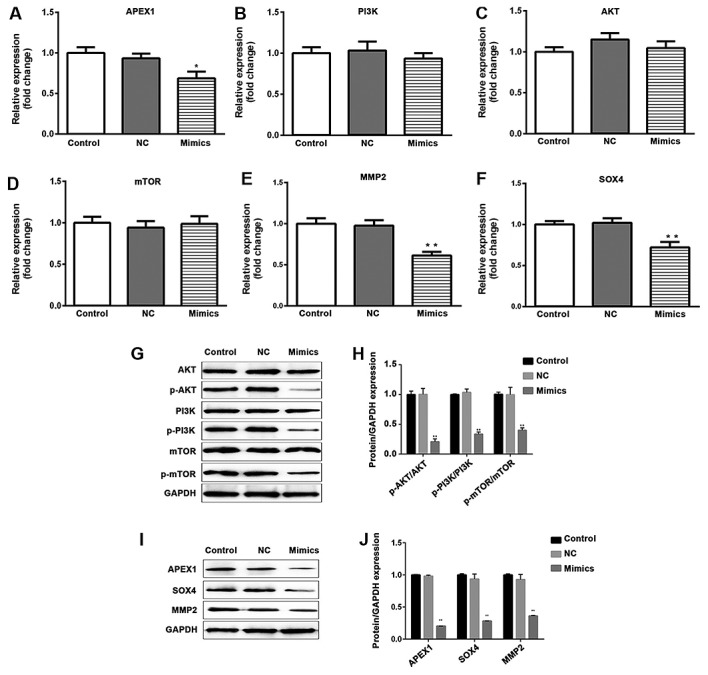
Figure 5.

Overexpression of miR-296-3p does not affect the mRNA and protein expression levels of PI3K, AKT and mTOR; however, it does reduce the phosphorylation of PI3K, AKT and mTOR. mRNA and protein levels of APEX1, MMP2 and SOX4 were decreased following transfection of A549 cells with miR-296-3p mimics. The mRNA expression levels of (A) APEX1, (B) PI3K, (C) AKT, (D) mTOR, (E) MMP2 and (F) SOX4 were detected using reverse transcription-quantitative polymerase chain reaction. (G) Protein levels of total PI3K, p-PI3K, total AKT, p-AKT, total mTOR and p-mTOR were examined using western blot analysis. GAPDH was used as a normalization control. (H) Quantification of the ratios of p-AKT/AKT, p-PI3K/PI3K and p-mTOR/mTOR. (I) Protein levels of APEX1, MMP2 and SOX4 were measured by western blot analysis. (J) The fold change of proteins/GAPDH according to the APEX1, MMP2 and SOX4 protein levels. Data are presented as the mean ± standard deviation. *P<0.05, **P<0.01 vs. NC. miR, microRNA; PI3K, phosphoinositide-3-kinase; AKT, AKT serine/threonine kinase; mTOR, mammalian target of rapamycin; MMP2, matrix metallopeptidase 2; SOX4, SRY-box 4; p-, phosphorylated-; NC, negative control.
