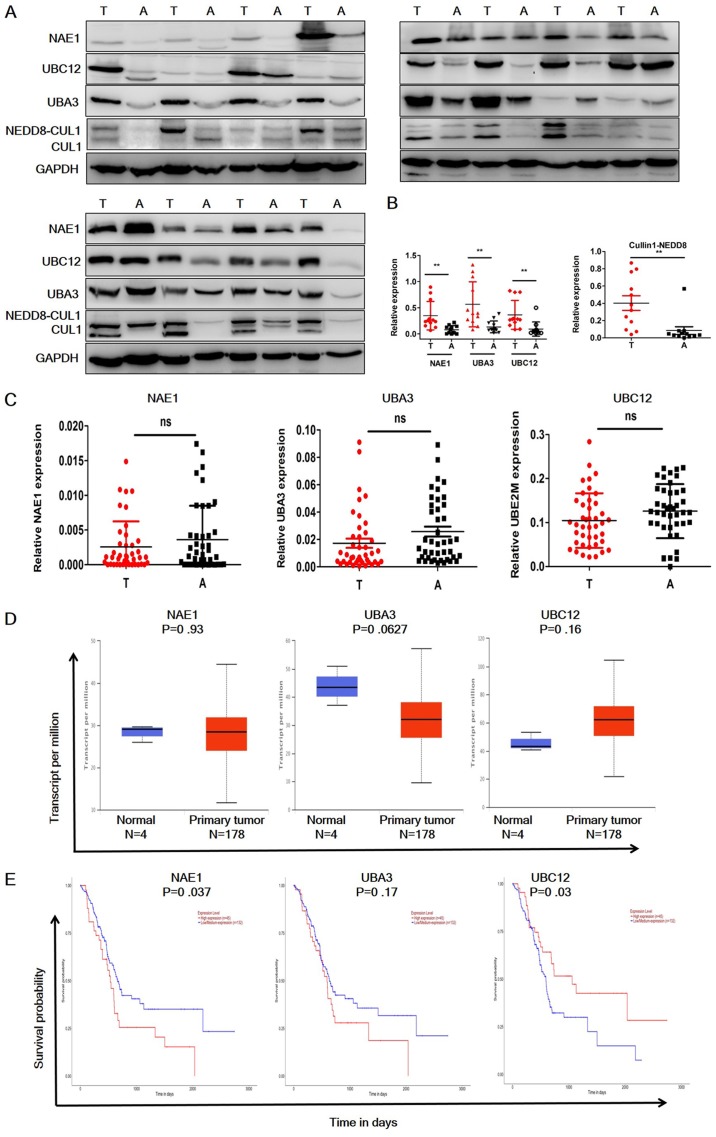
Figure 1.
Expression profile of neddylation pathway members in pancreatic cancer tissues. (A) Western blot analysis of the expression levels of neddylation pathway molecules in pancreatic cancer and adjacent normal tissues (n=12). (B) Quantification of western blot results. A total of 12 cancer and normal adjacent tissue pairs were analyzed. (C) Reverse transcription-quantitative PCR analysis of the mRNA expression levels of neddylation pathway molecules in pancreatic cancer and adjacent normal tissues. (D) Relative mRNA expression levels of neddylation pathway molecules in pancreatic cancer and adjacent normal tissues in The Cancer Genome Atlas dataset. (E) Kaplan-Meier plots showing the survival of patients with pancreatic cancer, grouped by high and low mRNA expression levels. The results are presented as the mean ± standard deviation. **P<0.01. T, tumor; A, adjacent; NAE-1, NEDD8 activating enzyme E1 subunit; UBA3, ubiquitin like modifier activating enzyme 3; UBC12, NEDD8-conjugating enzyme Ubc12; NEDD8, Neural precursor cell-expressed, developmentally downregulated 8; CULl, cullin 1.

