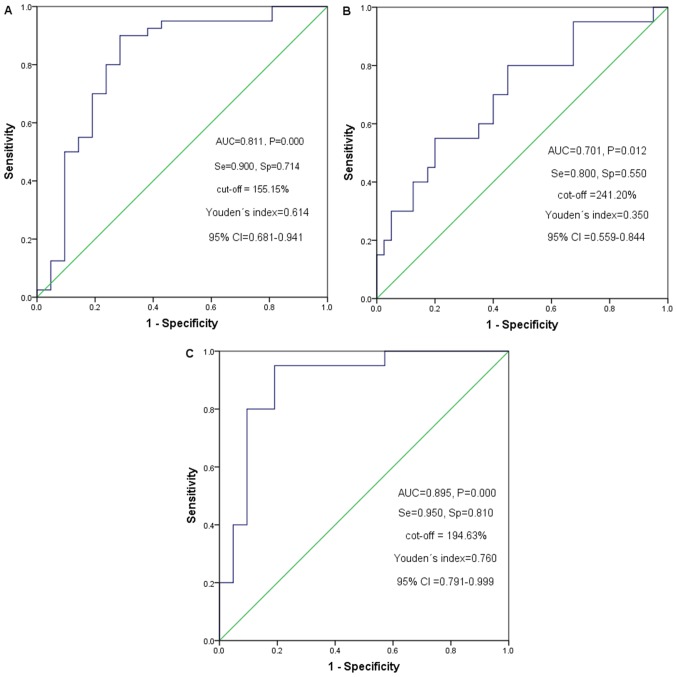
Figure 4.
ROC curve of the optimal cut-off point for the T1(L-H)/H (%) of grades I, II and III HCC. ROC curve of (A) grade I and II HCC, (B) grade II and III HCC, and (C) grade I and III HCC. ROC, receiver operating characteristic; AUC, area under the curve; Se, sensitivity; Sp, specificity; CI, confidence interval; HHC, hepatocellular carcinoma.

