Figure 2.
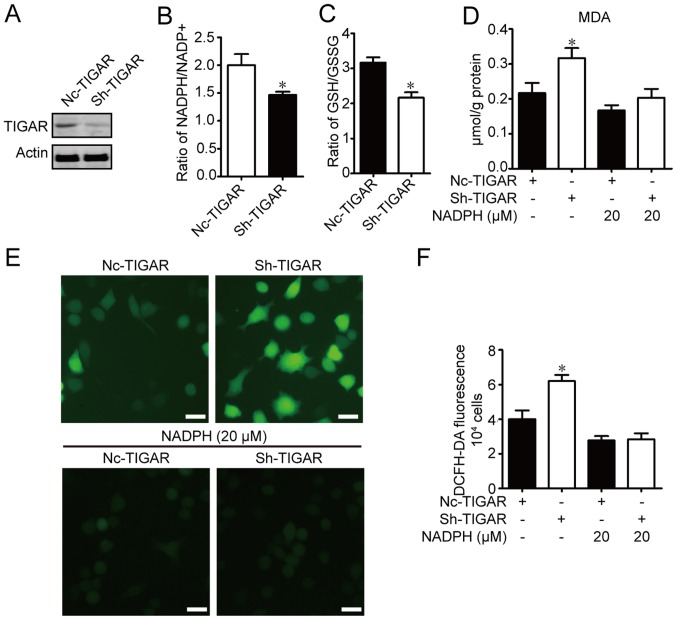
TIGAR attenuates oxidative stress through NADPH in U-87MG glioma cells. U-87MG cells were infected with NC-TIGAR or sh-TIGAR, and were cultured for >2 weeks in the presence of puromycin (2 µg/ml) prior to further experiments. (A) TIGAR expression was measured using western blot assay. Ratios of (B) NADPH/NADP+ and (C) GSH/GSSG were measured in U-87MG/NC cells and U-87MG/sh-TIGAR cells. (D) MDA contents were measured in U-87MG/NC, U-87MG/sh-TIGAR, NADPH-pretreated U-87MG/NC and U-87MG/sh-TIGAR cells. (E) Intracellular ROS levels in U-87MG/NC, U-87MG/sh-TIGAR, NADPH-pretreated U-87MG/NC and U-87MG/sh-TIGAR cells were monitored using DCFH-DA under a fluorescence microscope. Scale bar, 20 µm. (F) Intracellular ROS levels in U-87MG/NC, U-87MG/sh-TIGAR, NADPH-pretreated U-87MG/NC and U-87MG/sh-TIGAR cells were determined using DCFH-DA on a microplate reader. The histogram shows the mean ROS production. Data of the triple experiments are presented as the means ± standard deviation. *P<0.05 vs. NC-TIGAR group according to an unpaired t-test/one-way analysis of variance. GSH, glutathione; GSSG, oxidized glutathione; MDA, malondialdehyde; NADP+, nicotinamide adenine dinucleotide phosphate; NADPH, reduced NADP+; NC, negative control shRNA; ROS, reactive oxygen species; sh, short hairpin RNA; TIGAR, TP53 induced glycolysis regulatory phosphatase.

