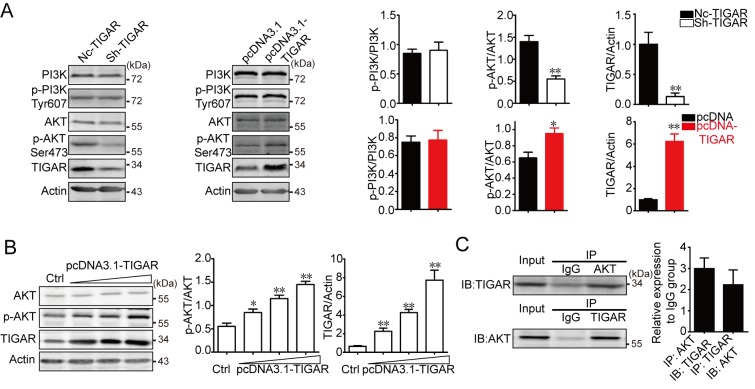
Figure 5.
TIGAR promotes AKT activation and interacts with AKT in U-87 glioma cells. (A) U-87MG cells were infected with sh-TIGAR to downregulate TIGAR expression or transfected with pcDNA3.1-TIGAR to increase TIGAR expression. PI3K, p-PI3K, AKT and p-AKT were measured in U-87MG/NC, U-87MG/sh-TIGAR, U-87MG/pcDNA3.1 and U-87MG/pcDNA3.1-TIGAR cells. TIGAR promoted the phosphorylation of AKT. β-actin was used as an internal control. Bar graphs depict semi-quantitative analysis of protein expression levels. (B) U-87MG cells cultured in 6-well plates were transfected with 1, 2 or 3 µg pcDNA3.1-TIGAR. TIGAR promoted the phosphorylation of AKT in a dose dependent manner, which was assessed using western blotting. Bar graphs depict semi-quantitative analysis for p-AKT and TIGAR. (C) Physical interactions between TIGAR and AKT in U-87MG cells were confirmed using a co-immunoprecipitation assay. Bar graph depicts semi-quantitative analysis for TIGAR and AKT when compared with the IgG group. Data of the triple experiments are presented as the means ± standard deviation. *P<0.05, **P<0.01 vs. NC-TIGAR or pcDNA3.1. AKT, protein kinase B; Ctrl, control; IgG, immunoglobulin G; NC, negative control; p, phosphorylated; PI3K, phosphoinositide 3-kinase; sh, short hairpin RNA; TIGAR, TP53 induced glycolysis regulatory phosphatase.

