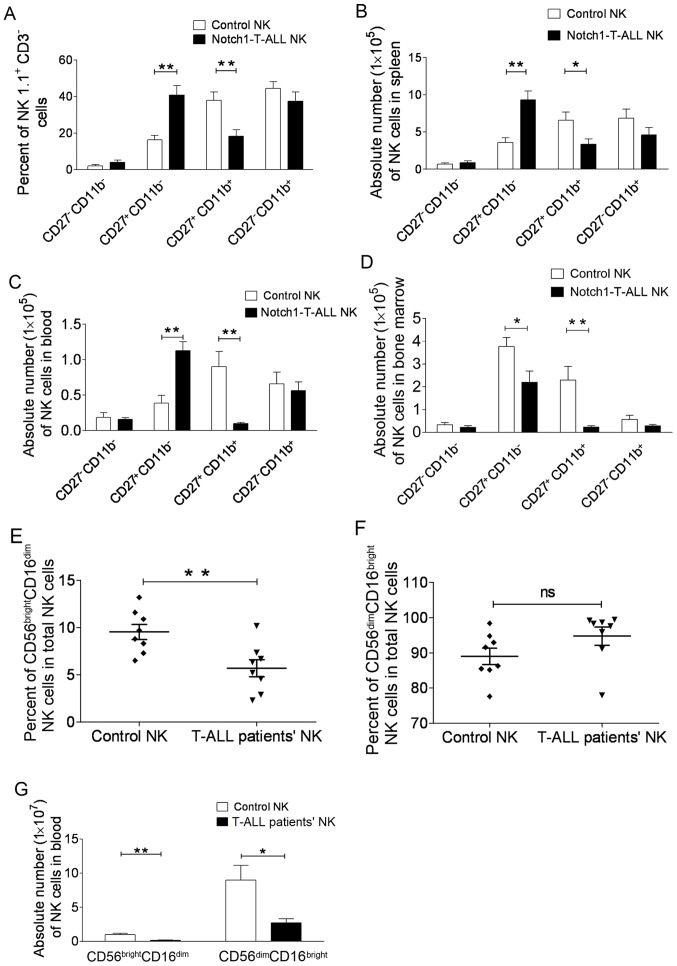
Figure 2.
Mature NK cell populations are altered in both Notch1-T-ALL mice and patients with T-ALL. Freshly isolated splenocytes were obtained from Notch1-T-ALL mice or control WT C57BL/6 mice. (A) Percentage of CD27−CD11b−, CD27+CD11b−, CD27+CD11b+ and CD27−CD11b+ NK cells in NK1.1+ CD3−NK cell populations. Absolute numbers of NK cell subsets from the (B) spleen, (C) peripheral blood and (D) bone marrow. Freshly isolated peripheral blood cells from newly diagnosed patients with T-ALL or healthy controls. (E) Percentage of CD56brightCD16dim and (F) CD56dim CD16bright NK cells in the total NK cell population. (G) Absolute number of CD56brightCD16dim and CD56dimCD16bright NK cells. A-D: n=10 mice per group. E-G: n=8 healthy control group, and n=8 untreated T-ALL patients. The data are presented as the mean ± standard deviation; *P<0.05 and **P<0.01, as determined by one-way ANOVA or the unpaired Student's t-test. T-ALL, T-cell acute lymphoblastic leukemia; NK, natural killer; Notch1, neurogenic locus notch homolog protein 1; ns, not significant.

