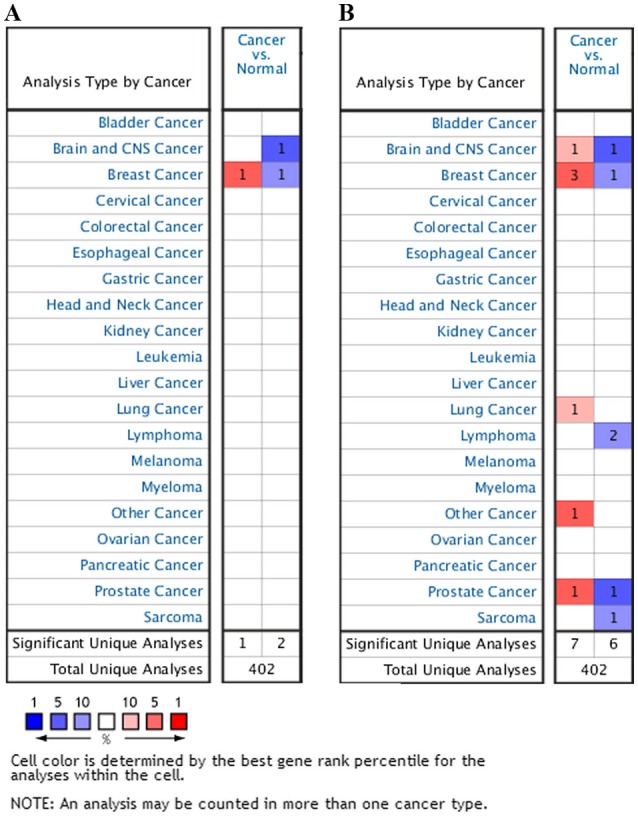
Figure 1.

HUWE1 mRNA expression levels in various cancer types compared with normal tissue controls. The left column in red indicates the number of datasets in which the expression level of HUWE1 was upregulated and the right column in blue represents the number of datasets in which the expression level of HUWE1 was downregulated in cancer tissues compared with normal tissues. The search criteria threshold was set at: (A) P<0.0001, fold-change >2 and a gene rank percentile of 10%, and (B) P<0.001, fold-change >2 and a gene rank percentile of 10%. HUWE1, E3 ubiquitin-protein ligase.
