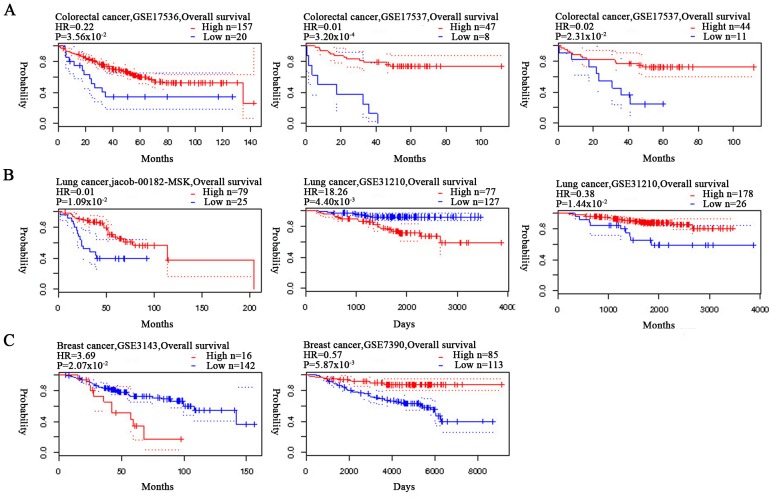
Figure 3.
Associations between the overall survival rates of patients with colorectal, lung and breast cancer, and HUWE1 expression levels, according to the PrognoScandatabase. Survival curves were plotted according to HUWE1 expression, comparing patients with high (red) and low (blue) expression levels. Analysis was performed for (A) colorectal, (B) lung and (C) breast cancer. HR, hazard ratio; HUWE1, E3 ubiquitin-protein ligase.

