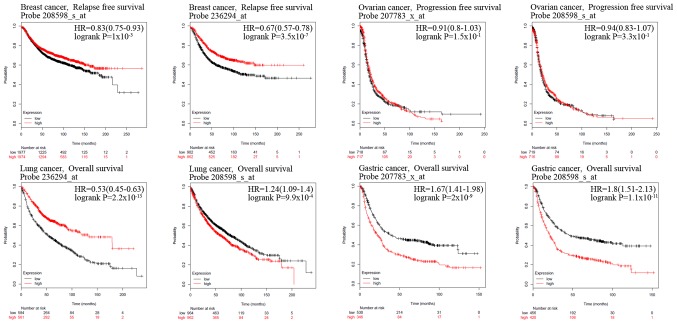
Figure 4.
Kaplan-Meier curves for patients with breast, ovarian, lung and gastric cancer according to HUWE1 expression. Kaplan-Meier curves were generated to compare the survival rates of patients with high (red) and low (black) expression levels of HUWE1. HUWE1, E3 ubiquitin-protein ligase; HR, hazard ratio.

