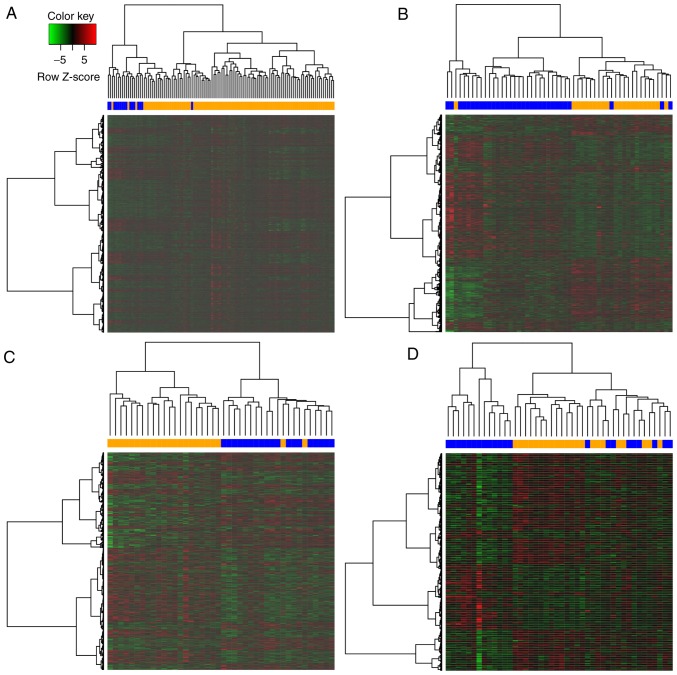
Figure 1.
Hierarchical cluster analysis based on DEGs for each cancer type. (A) The heatmap of 6,015 DEGs in estrogen receptor-negative breast cancer. (B) The heatmap of 2,074 DEGs in ovarian cancer. (C) The heatmap of 2,141 DEGs with rectal cancer. (D) The heatmap of 954 DEGs in gastric cancer. The color bar of the heatmap represents the sample groups: Blue indicates a chemosensitive sample, and orange represents a chemoresistant sample. DEGs, differentially expressed genes.

