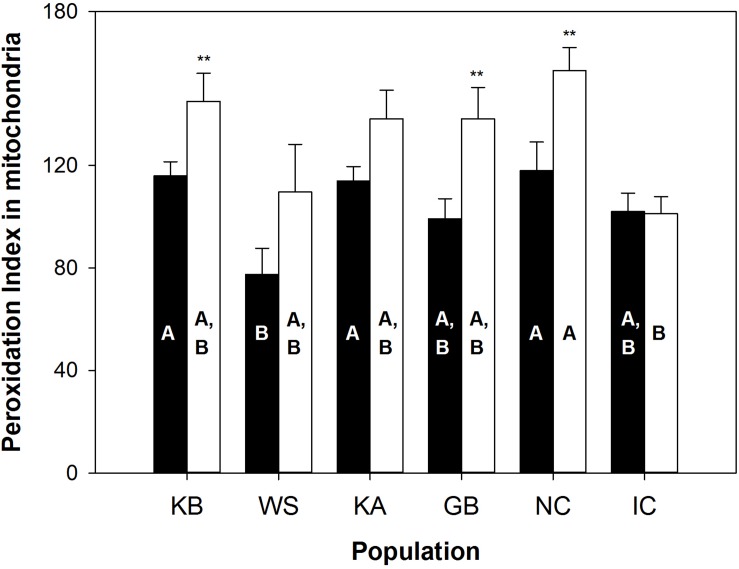
FIGURE 1.
Peroxidation index in mitochondria from A. islandica populations ranked from shortest- to longest-lived. Values are means ± SEM. Letters denote significant (p ≤ 0.05) differences between populations for gills (filled bars) and mantle (empty bars) tissues, while asterisks indicate significant differences between tissues (∗∗p ≤ 0.05).

