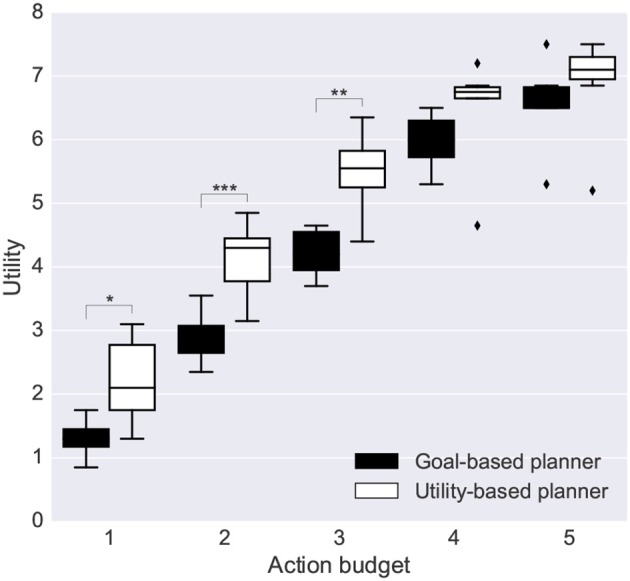
Figure 12.

Performance of the goal-based planner and the utility-based planner. Each bar is the average utility over 10 repetitions of the intrinsic-phase training and 20 runs of the extrinsic-phase test. Statistical significance was computed with a double-tailed t-test (Mid-line of boxes shows median values, boxes show quartiles, and bars show the min-max range, of the intrinsic-phase repetitions): *p < 0.05; **p < 0.01; and ***p < 0.001.
