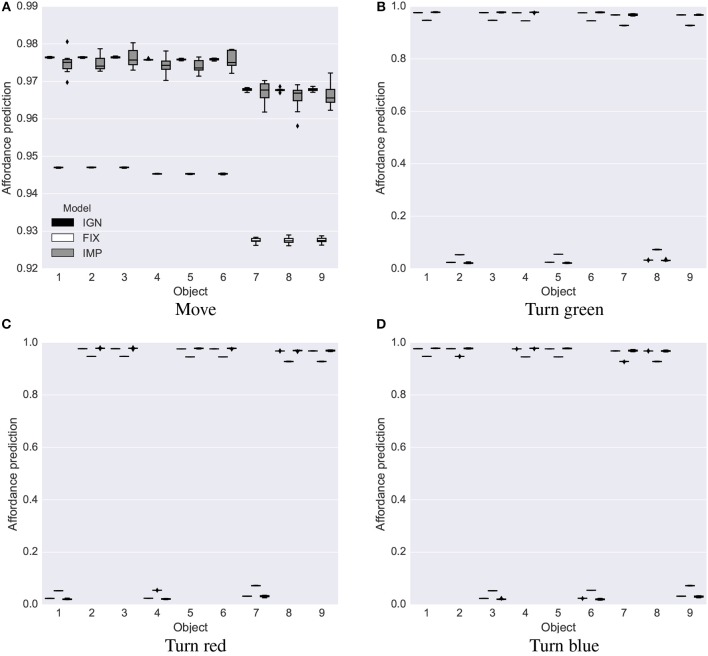
Figure 5.
Base test: affordance predictions (y-axis) after 6,000 learning steps for the four actions (four graphs) and nine objects (x-axis) averaged over 10 trials in the base test, for the IGN, FIX, and IMP systems. Mid-line of boxes shows median values, boxes show quartiles, and bars show the min-max range. The target values that the predictors had to estimate were 0 or 1. (A) Move. (B) Turn green. (C) Turn red. (D) Turn blue.

