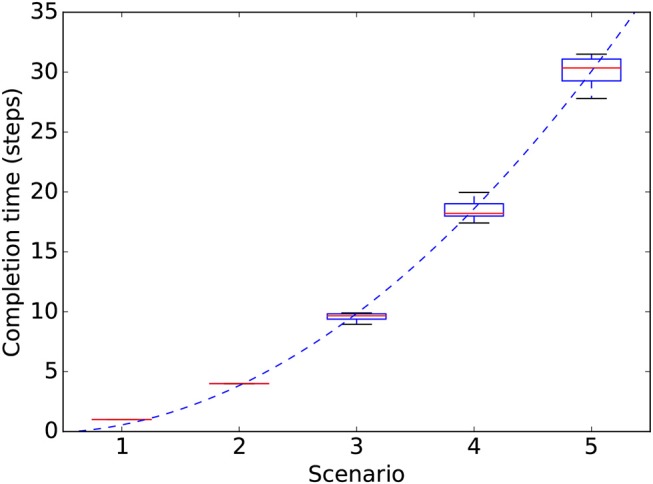
Figure 6.

Completion times (y-axis) for the IMP system in the different extrinsic-phase scenarios involving an increasing number of objects (x-axis). Data refers to 100 simulations (10 runs of the extrinsic-phase test for each of the 10 runs of the intrinsic-phase learning process). For each scenario, the mid-line of boxes shows median values, boxes show quartiles, and bars show the min-max range. The dashed line shows a quadratic fit: y = ax2 + bx = 1.364x2 − 0.808x.
