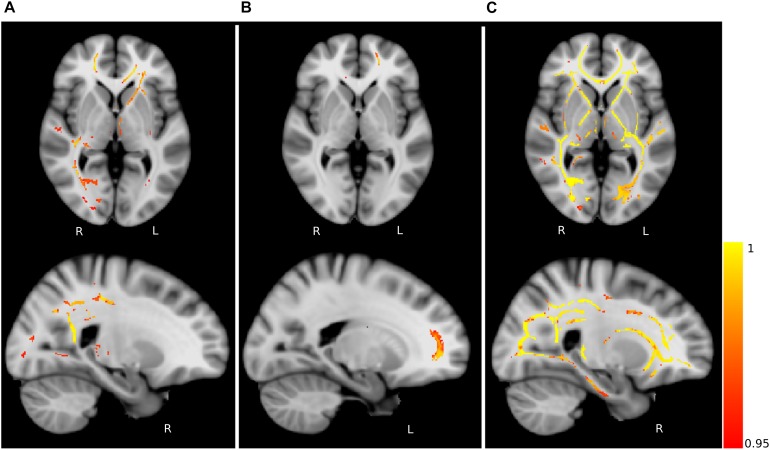
FIGURE 4.
Fractional anisotropy (FA) differences. Axial and sagittal slices showing significant differences between (A) young and middle-aged healthy controls (HCY > HCM), (B) middle-aged healthy controls and PD patients (HCM > PD) and (C) young healthy controls and PD patients (HCY > PD). The slices show the threshold-free cluster enhancement (TFCE) thresholded results (p < 0.05, FWE corrected) superimposed on the FSL’s 1 mm MNI152 standard brain. The scale [1 – p-value] represents the significance of the clusters with yellow indicating higher and red indicating lower statistical significance. L and R denote the left and right hemisphere of the brain.

