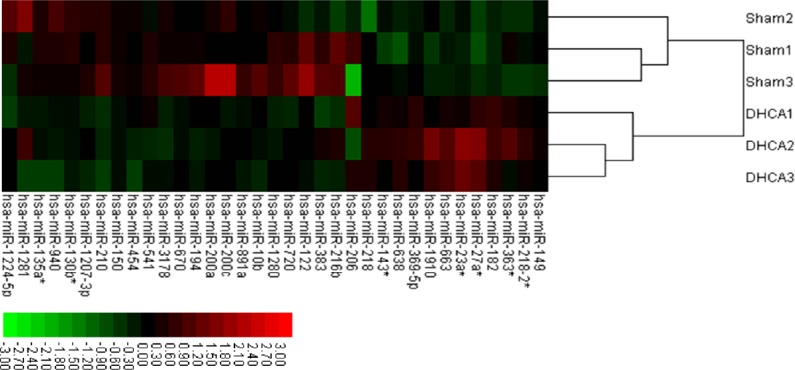
Figure 2.

Hierarchical clustering of differentially expressed miRNAs in the hippocampus of sham and DHCA-treated piglets.
Each row represents one miRNA with significantly different expression between sham and DHCA groups (P < 0.01). Each column represents a biological replicate; in each panel, the left three columns represent sham piglets, while the right three represent DHCA-treated piglets. Colors represent the expression of each miRNA: red, upregulation; green, downregulation. DHCA: Deep hypothermic circulatory arrest.
