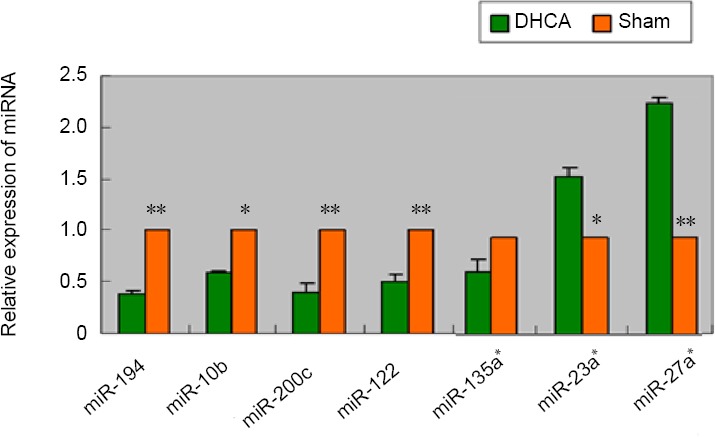
Figure 7.

Validation of miRNA microarray data by quantitative reverse transcription-polymerase chain reaction.
Relative expression of six miRNAs was normalized to the expression of an internal control (U6) using 2–ΔΔCT to calculate the difference in expression. P values were calculated using a two-sided Student’s t-test. *P < 0.05, **P < 0.01, vs. sham group. Temporal expression profiles of selected regulated miRNAs as determined by quantitative reverse transcription-polymerase chain reaction analysis of hippocampal RNA. miRNAs, such as miR-194, -200c, -10b, and -122, were selected from the panel of downregulated miRNAs; and miR-27a* and -23a* were selected from the panel of upregulated miRNAs to confirm the findings of microarray and bioinformatic analyses. Data represent changes in threshold cycle between DHCA and sham groups (ΔCt = Ctsham−CtDHCA; n = 3). DHCA: Deep hypothermic circulatory arrest.
