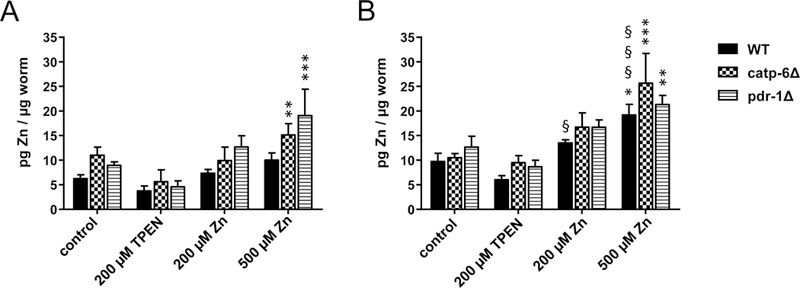
Figure 2:

Total Zn in WT, catp-6Δ and pdr-1Δ following TPEN or Zn exposure. Zn concentrations in [A]: day 2 adults and [B]: day 5 adults of the respective C. elegans strains were determined using ICP-MS/MS after exposing L4 larvae or day 4 adults to 200 μM TPEN, 200 μM or 500 μM Zn via feeding enriched OP50 E. coli for 24 h. Data are expressed as means of at least 4 determinations + SEM normalized to worms’ weight. *: p < 0.05, **: p < 0.01, and ***: p < 0.001 compared to WT controls. §: p < 0.05, §§: p < 0.01, and §§§: p < 0.001 compared to respective same conditions in day 2 adults.
