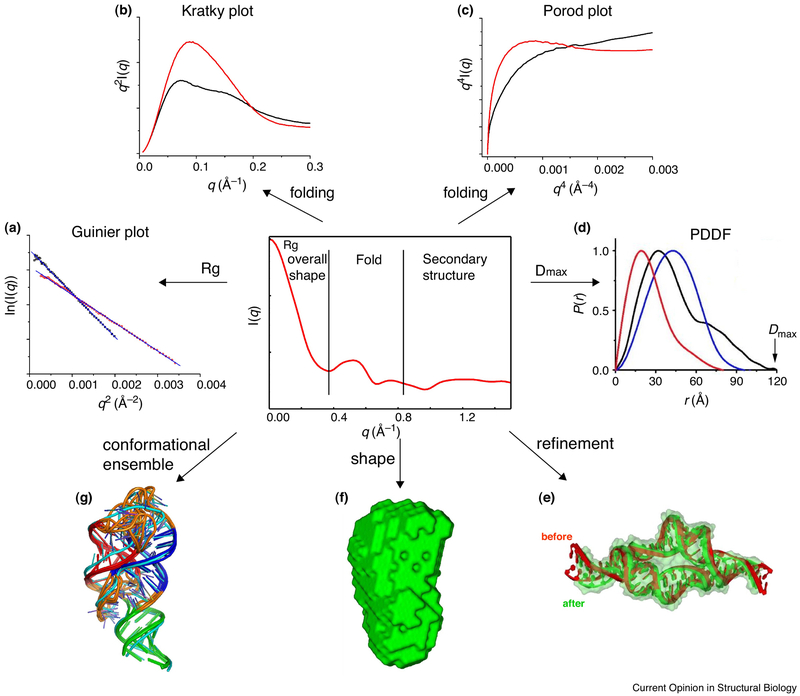
Figure 1.
A schematic illustration of useful information that can be extracted from SAXS data. (a). Guinier plot from which one can obtain radius of gyration and approximate molecular weight; (b) & (c) Kratky and Porod plots to characterize dynamics and folding [12••]; (d) Pair distance distribution function (PDDF) to derive maximum dimension, Dmax and weighted distance distribution tally; (e) Refining RNA structure by restraining global dimension [56•]; (f) generating global molecular shapes [6••]; (g) calculating conformational ensembles.

