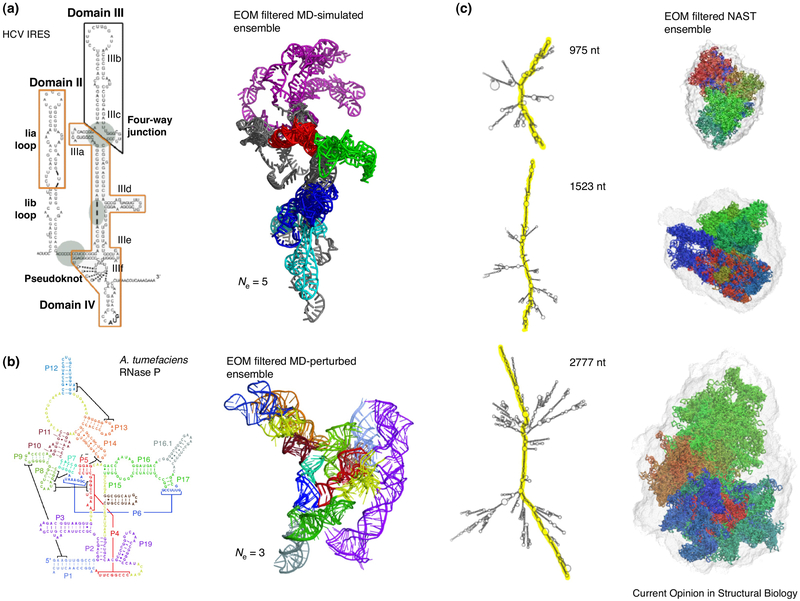
Figure 6.
Characterizing RNA conformation space using SAXS. (a) SAXS-filtered MD-simulated ensemble of the HCV IRES RNA [76•]. An ensemble of five can best fit the experimental SAXS data; (b) In the case of RNase P it requires an ensemble of three to best fit experimental SAXS data [75]; (c) SAXS-filtered ensembles of models generated using a nucleic acid simulation tool (NAST) [95].

