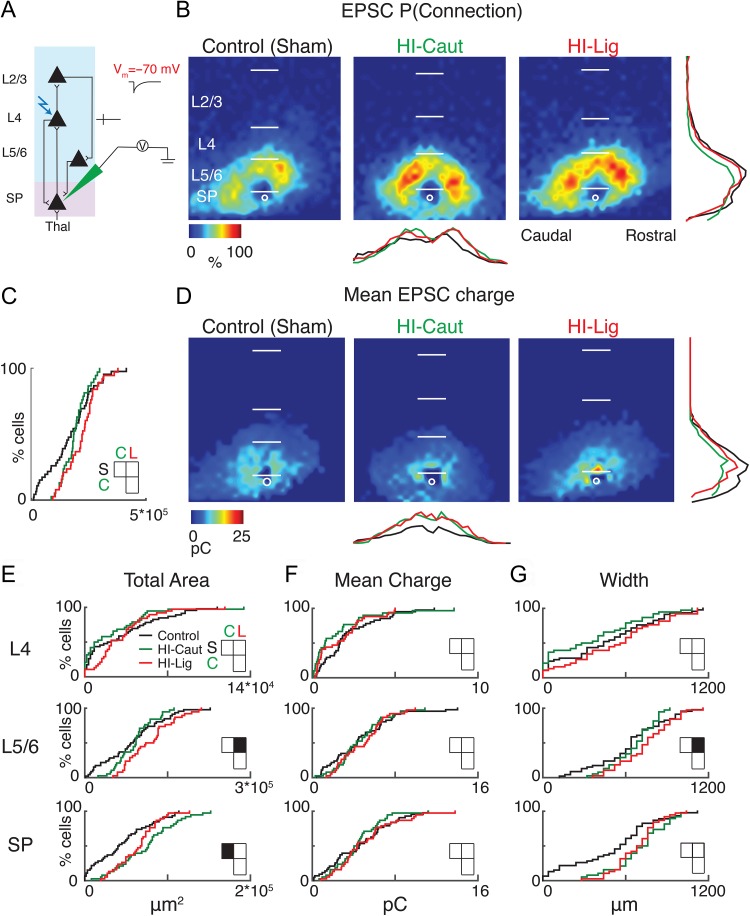
Figure 3.
HI-Caut results in hyperconnectivity of excitation from SP, while HI-Lig results in hyperconnectivity from L5/6. (A) Schematic view of electrode positioning in the layer recorded and laser photostimulation location (photostimulation from pia to SP; see methods for more details). (B) Spatial distribution of probability of connection P(Connection) for excitatory (−70 mV) connections. Horizontal bars indicate layer boundaries and serve as scale bar of 200 μm. Black, green, and red overlay traces on the side of the maps indicate summed EPSC marginal distributions for each group. (C) Cumulative distribution function (CDF) of excitatory input to SPNs from all layers. Comparisons for S = Control, C = Caut, L = Ligated. Total area: (S–C) P = 0.80, (S–L) P = 0.10, (C–L) P = 0.55. (D) Spatial distribution of transferred charge (mean EPSC Charge) for excitatory (−70 mV) connections. (E–G) Cumulative distribution function (CDF) of excitatory input to SPNs. Layer totals for area (left), mean transferred charge (middle), and marginal width along rostral-caudal axis (right) for L4, L5/6, and SPN input to the recorded SPN. Black squares in the matrix denote significance, white squares are not significant.

