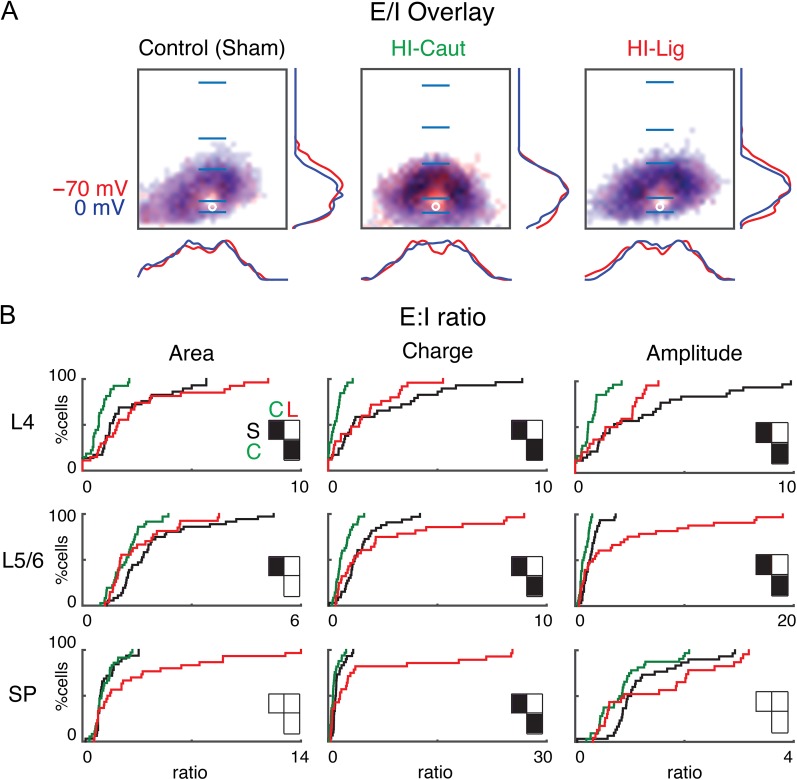
Figure 5.
Balance of excitatory and inhibitory input to SP for the different conditions. (A) Summary schematic of excitatory and inhibitory input probabilities to SPNs superimposed (Control, left; HI-Caut, center; HI-Lig, right). Red color represents excitatory input, and blue color represents inhibitory input to SP. Red and blue overlaying traces on the sides of the maps indicate summed EPSC and IPSC marginal distributions. Blue bars mark layer boundaries and denote 200 μm. (B) Cumulative distribution function (CDF) of the ratio of excitatory to inhibitory input as it changes as a result of the different injuries for both area (left), charge (middle), and amplitude (right) for L4, L5/6, and SP.

