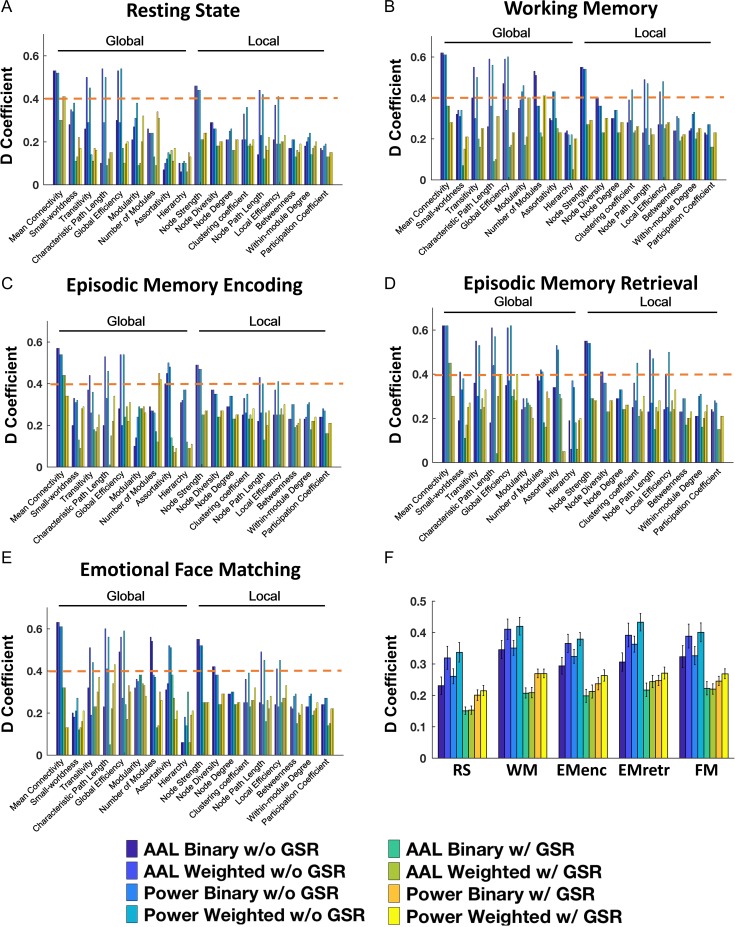
Figure 3.
Reliability for examined graph properties, paradigms and processing schemes in the D study context, wherein Nsites = 1 and Nsessions = 1, simulating the design of the typical “big data” application involving pooling of data from different scanning sites (A: resting state; B: working memory; C: episodic memory encoding; D: episodic memory retrieval; E: emotional face matching). (F) The statistical comparison between different paradigms and schemes by averaging all graph properties. The orange dashed lines indicate the level of fair reliability (⩾0.4).

