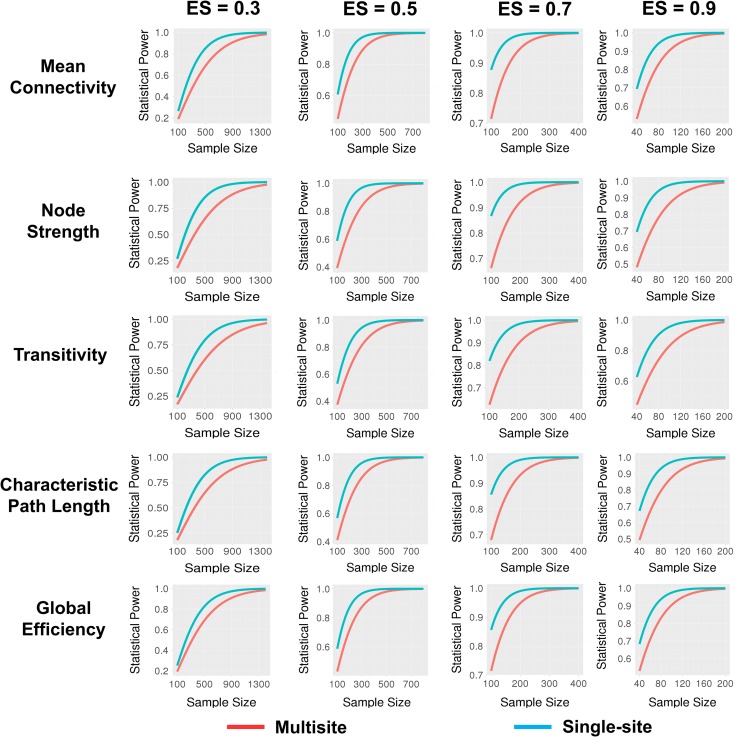
Figure 5.
Statistical power as a function of total sample size across multiple effect sizes for 5 selected connectomic measures. The red lines represent power for multisite studies while the blue lines represent power for single-site studies, based on Cohen’s d for 2-tailed contrast of 2 independent groups at α = 0.05. The effect sizes have been adjusted downward for observed reliabilities of each connectomic measure in the multisite and single-site contexts, respectively.

