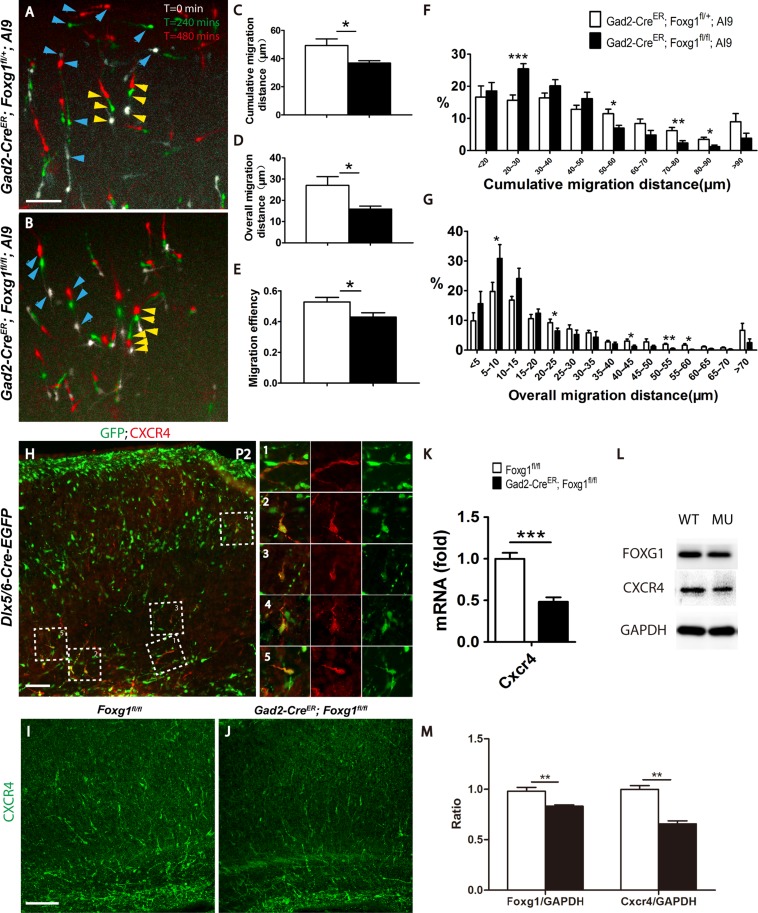
Figure 4.
The ablation of Foxg1 resulted in a decreased migration capacity. (A–B) Merge of 3 images of cultured P2 cortical slices showing the time-lapsed movement of interneurons within 480 min. White indicates the location of cells when the observation starts (t = 0 min), green indicates after 240 mins, the location where migrating cells migrated to, and red indicates the final location of migrating cells after 480 mins. Three aligned arrowheads indicate the migrating direction of each interneuron. Blue arrowheads represent the long-distance migrating cells and the yellow arrowheads represent the short-distance migrating cells. (A) The control interneurons migrated a longer distance. (B) The mutant interneurons. (C–E) Histograms of the cumulative (C; Control n = 1282 neurons from 9 slices, Mu, n = 1087 neurons from 8 slices; P = 0.0317) and overall (D, P = 0.0270) migration distances and the migration efficiency (E, P = 0.0317). (F–G) Distribution of the percentages of cumulative (F, 20–30 μm, P = 0.0006; 50–60 μm, P = 0.0161; 70–80 μm, P = 0.0068; 80–90 μm, P = 0.0135) and overall (G, 5–10 μm, P = 0.043; 20–25 μm, P = 0.0485; 40–45 μm, P = 0.0381; 50–55 μm, P = 0.0013; 55–60 μm, P = 0.013) migration of P2 interneurons. (H) Immunostaining on P2 cortex revealed that CXCR4 was expressed in interneurons on the tangential migrating stream (H-1) and the radial migrating interneurons (H2–H5). (I–J) Immunostaining revealed decreased CXCR4 expression level in the mutant (J) compared with that of the control (I). Q-PCR (K; Control, n = 5; MU, n = 4; P = 0.0004) and western blot analyses of Foxg1 and CXCR4 (L). (M) The comparative analysis of Foxg1 and CXCR4 at protein level (n = 4, P = 0.006). Scale bar: 100 μm in A, B, H, I; 50 μm in L-M”. Student’s t-test, *P < 0.05, **P < 0.01, ***P < 0.001.

