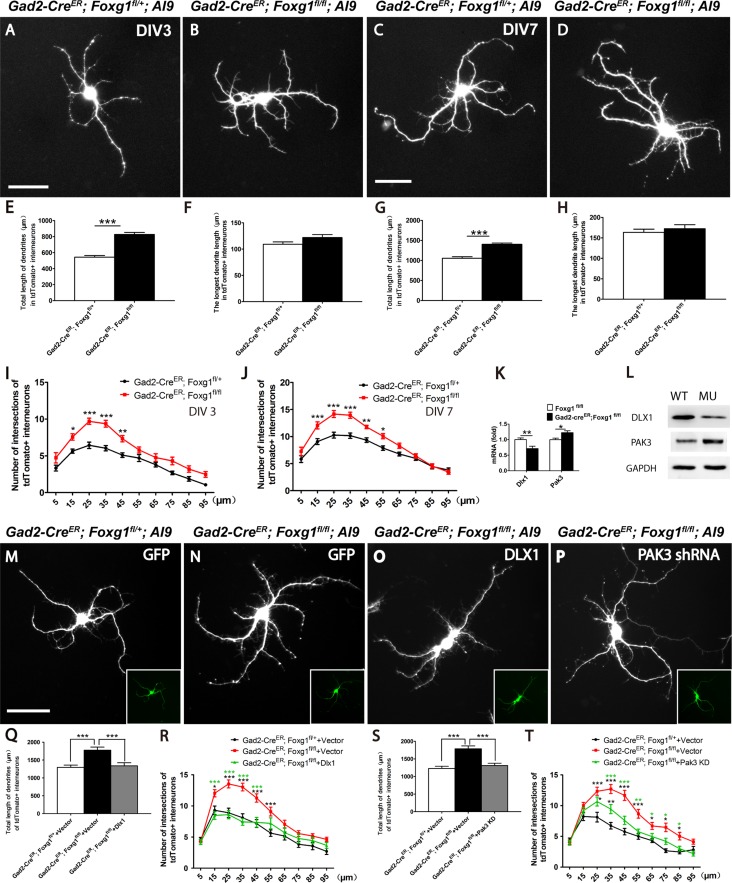
Figure 5.
Foxg1 restricted the growth of cortical interneuron dendrites. (A–B) Representative micrographs of tdTomato+ interneurons from the controls (A) and mutants (B) at 3 DIV showing enhanced dendritic complexity of the mutant interneurons. (C–D) Representative micrographs of tdTomato+ interneurons from the controls (C) and mutants (D) at 7 DIV show that the dendritic complexity further increased in the mutants. (E) The total dendrite length in the mutant interneurons was increased at 3 DIV compared with that in the controls (Control, n = 30; Mu n = 31; P = 4.83756E-12). (F) No changes in the length of the longest neurite were detected between the mutants and controls at 3 DIV (Control, n = 30; Mu n = 31; P = 0.087). (G) The total length of mutant interneuron dendrites was remarkably increased at 7 DIV compared with 3 DIV (Control, n = 30; Mu n = 30; P = 2.11852E-09). (H) No changes in the length of the longest neurite were detected between mutants and controls at 7 DIV (Control, n = 30; Mu n = 30; P = 0.4779). (I) Sholl analysis of the numbers of dendritic branches in tdTomato+ interneurons from the mutants and the controls at 3 DIV. (n = 30, two-way ANOVA (F9, 522 = 2.211, P < 0.0001) with Bonferroni’s post hoc test, P < 0.05 at 15, 25, 35 and 45 μm away from the cell body). (J) The same result was obtained when the Sholl analysis of the dendritic branches was performed at 7 DIV (n = 30, compared by two-way ANOVA (F9, 622 = 5.174, P < 0.0001) with Bonferroni’s post hoc test, P < 0.05 at 15, 25, 35, 45, and 55 μm away from the cell body). (K–L) Levels of the Dlx1 and Pak3 mRNAs (K) and proteins (L). (M–P) Representative micrographs of tdTomato+ interneurons from the controls (M) and mutants (N) transfected with empty vector, mutants transfected with lentivirus carrying Dlx1 cDNA (N) and Pak3 shRNA (O) at 7 DIV showing that enhanced dendritic complexity of the mutant interneurons can be rescued. (Q–T) Both Dlx1 overexpression (Q) and the Pak3 knock down (S) decrease the total length of mutant dendrities (For Dlx1, n = 30, analyzed by one-way ANOVA (F2,89 = 11.29, P < 0.0001) with Bonferroni’s post hoc test, P < 0.001 between mutant and control, mutant and mutant-dlx1 overexpression; For Pak3 shRNA n = 30, analyzed by one-way ANOVA (F2,89 = 18.15, P < 0.0001) with Bonferroni’s post hoc test, P < 0.001 between mutant and control, mutant and mutant-Pak3 shRNA). (R, T) Sholl analysis revealed that overexpression of Dlx1 (n = 30, analyzed by two-way ANOVA (F18,870 = 3.281, P < 0.0001) with Bonferroni’s post hoc test, for control and mutant, P < 0.05 at 15, 25, 35, 45 and 55 μm away from the cell body (black asterisk), for mutant-Dlx1 and mutant, P < 0.05 at 15, 25, 35, and 45 μm away from the cell body (green asterisk)) has stronger effects than Pak3 shRNA (n = 30, analyzed by two-way ANOVA (F18,870 = 3.281, P < 0.0001) with Bonferroni’s post hoc test, for control and mutant, P < 0.05 at 25–85 μm away from the cell body (black asterisk), for mutant-Pak3 shRNA and mutant, P < 0.05 at 35–85 μm away from the cell body (green asterisk), for mutant-Pak3 shRNA and control, P < 0.05 at 25 and 35 μm away from the cell body (black asterisk)). Scale bar: 50 μm. Student’s t-test, *P < 0.05, **P < 0.01, ***P < 0.001.

