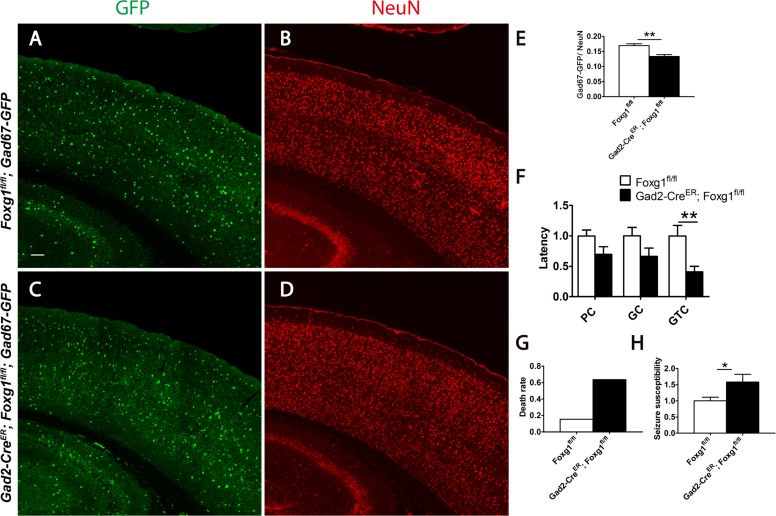
Figure 6.
A neural circuit imbalance and increased epileptic susceptibility in the Foxg1-deficient mice. (A–D) GFP-labeled interneurons (A, C) and immunostaining of anti-NeuN viewed total neurons (B, D). (E): The ratio of interneurons to total neurons was decreased in adults (Control, n = 13; Mu, n = 11; P = 0.0098). (F–H) The latencies of stage 2–4 seizures (F; Control, n = 13; Mu, n = 11; latency of GTC, P = 0.0086) after PTZ induction, the death rate (G) and the seizure score was analyzed and calculated from the latencies (H; Control, n = 13; Mu, n = 11; P = 0.0256). Scale bar: 100 μm. Student’s t-test, *P < 0.05, **P < 0.01.

