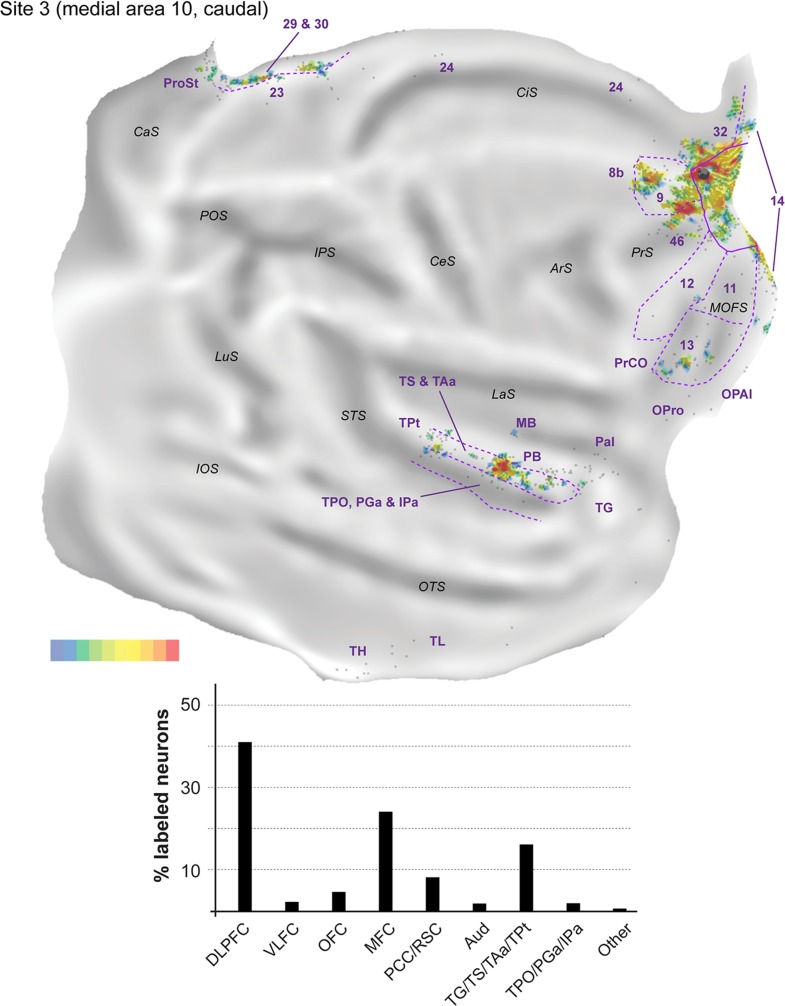
Figure 6.
Top: “Unfolded” reconstruction of the cerebral cortex in animal FR01, showing the pattern of label resulting from an injection of FE (site 3). Bottom: Summary of the percentages of extrinsic projection neurons labeled in different parts of the cerebral cortex. Conventions as for Figure 4. TH, TL: cytoarchitectural areas, defined according to the criteria described by Blatt et al. (2003) in the macaque.

