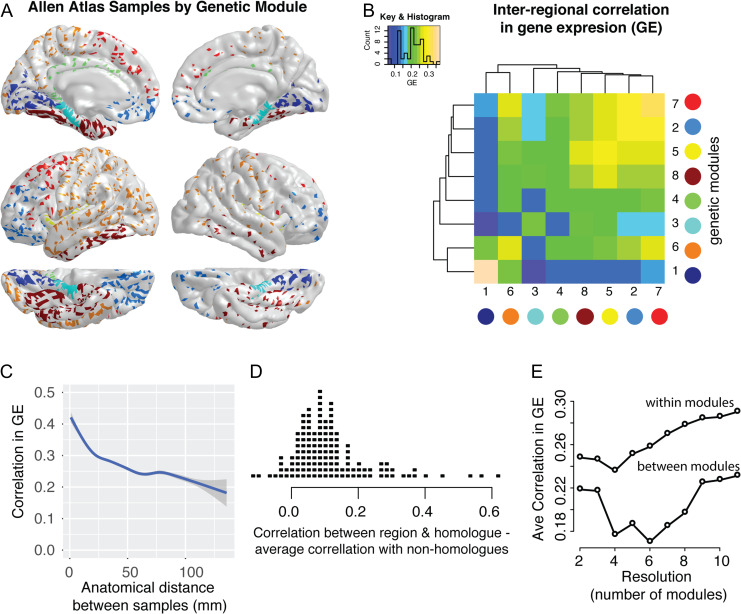
Figure 3.
Correlations in cortical gene expression (rGE) influenced by genetic correlation (ρg) modules, anatomical distance and contralateral homology. (A) Location of cortical samples available for 6 subjects in Allen Atlas, color-coded based on ρg module (as per Fig. 1C). (B) The intersample correlations in expression pattern across genes were calculated for each pair of samples (within subjects only). The heat map illustrates the average within-module rGE (diagonal elements) and the average between-module rGE (off-diagonal elements). (C) The relationship between anatomical distance and rGE (smoothed local average with standard error silhouettes). (D) For each of the FreeSurfer regions (for subjects with samples from both left and right hemispheres), the strip chart shows the difference between rGE with the contralateral homolog and the average rGE with non-homologous regions. (E) The correlation in gene expression patterns across genes across a range of modular resolutions from 2 to 11 genetic correlation modules, showing the average within-module and the average between module rGE across all modules.

