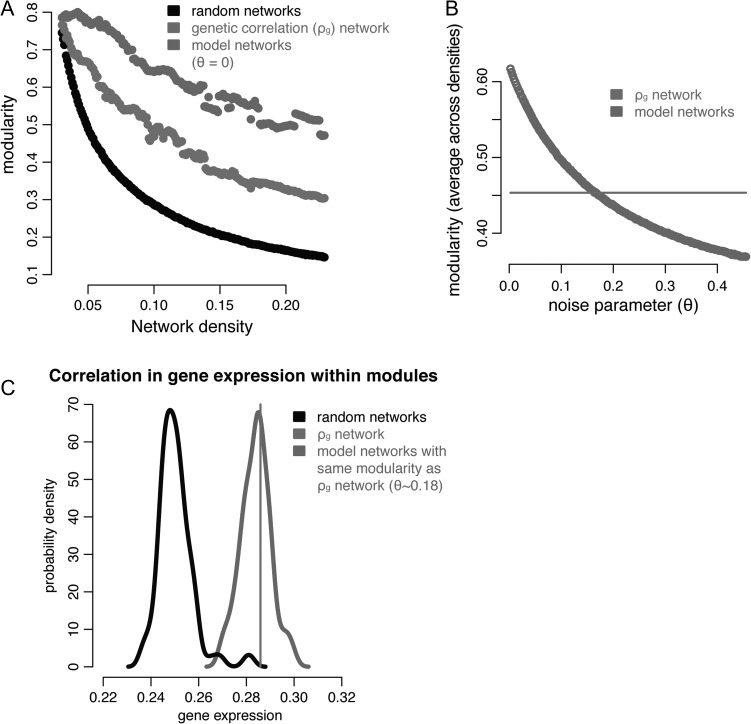
Figure 4.
Modeling the effect of anatomical distance and contralateral homology. (A) Modularity for genetic correlation networks and random networks as per Figure 1B. For model networks, inter-regional correlation is based on what would be predicted based on the statistical relationship with anatomical distance within and between hemispheres (Fig. 2) and a noise parameter ( in this subplot). (B) The modularity (averaged across densities) of the model networks at different values of , which superimposes noise on top of the predicted relationships. For , the modularity of the model networks intersects with that of the actual ρg network. (C) Probability density plots of the average within-module correlation in gene expression (rGE, see Fig. 3): for the actual ρg network modules (black line); for modules derived from 1000 randomly generated networks (light gray distribution); and for modules derived from 1000 modeled networks with the same modularity as the actual ρg network (dark gray distribution).

