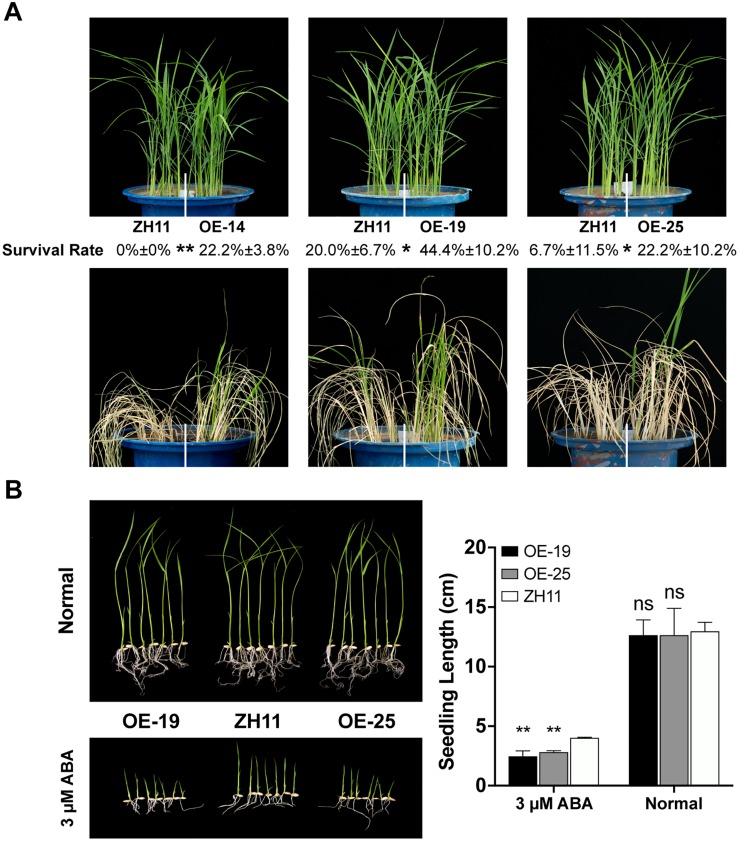
FIGURE 2.
SNAC1-OE plant phenotypes under drought stress and ABA treatment. (A) Drought resistance testing of SNAC1-OE lines. The survival rates of the SNAC1-OE and ZH11 plants after recovery are expressed as mean ± SD of three independent replicates. (B) Performance of SNAC1-OE (OE-19 and OE-25) and ZH11 in half-strength MS medium containing 0 (normal) or 3 μmol/L ABA. The measurement of seedling length after 10 days’ treatment is shown by the histogram. Error bar represents the SD of three independent replicates. Asterisk(s) in the figure represents the significant difference (OE versus ZH11) determined by the paired Student’s t-test (∗∗p < 0.01, *0.01 ≤ p < 0.05, ns: p ≥ 0.05).

