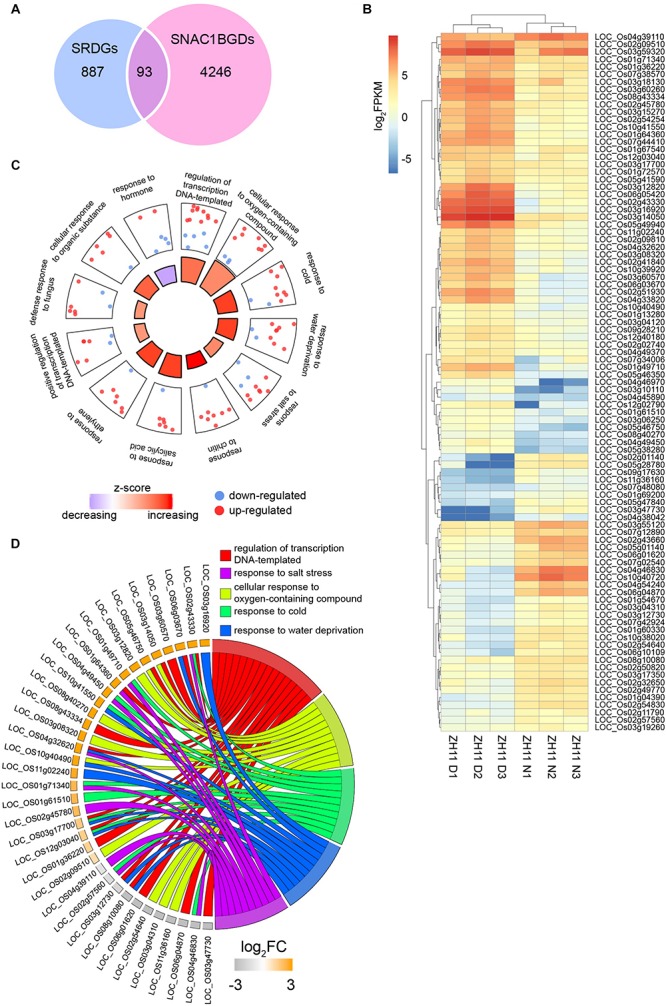
FIGURE 6.

Characterization of the 93 SNAC1TGDs. (A) Overlapped number of genes between the 4339 SNAC1BGDs from ChIP-Seq analysis and the 980 SRDGs from RNA-Seq analysis. (B) Expression patterns of the SNAC1TGDs in ZH11 in response to drought stress. (C) First 12 GO enrichments in the biological process category of the SNAC1TGDs. (D) Circular plot exhibiting genes involved in stress response related GO terms enriched in (C).
