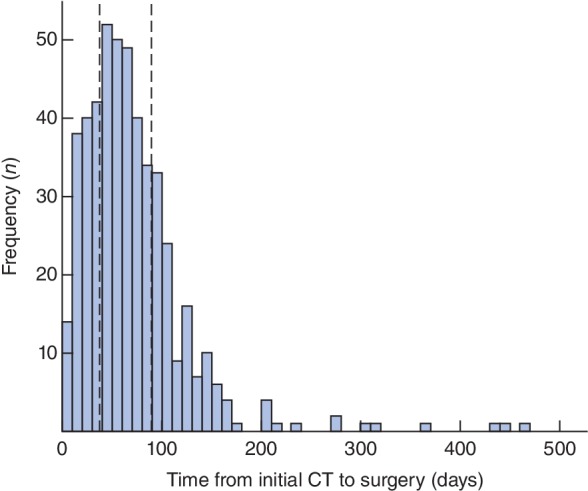
Figure 1.

Histogram of the time from diagnostic imaging to surgery. The plot includes all 483 patients who underwent surgery during the study interval. The bars have an interval width of 10 days. The dashed lines represent the lower and upper quartiles (37 and 90 days respectively)
