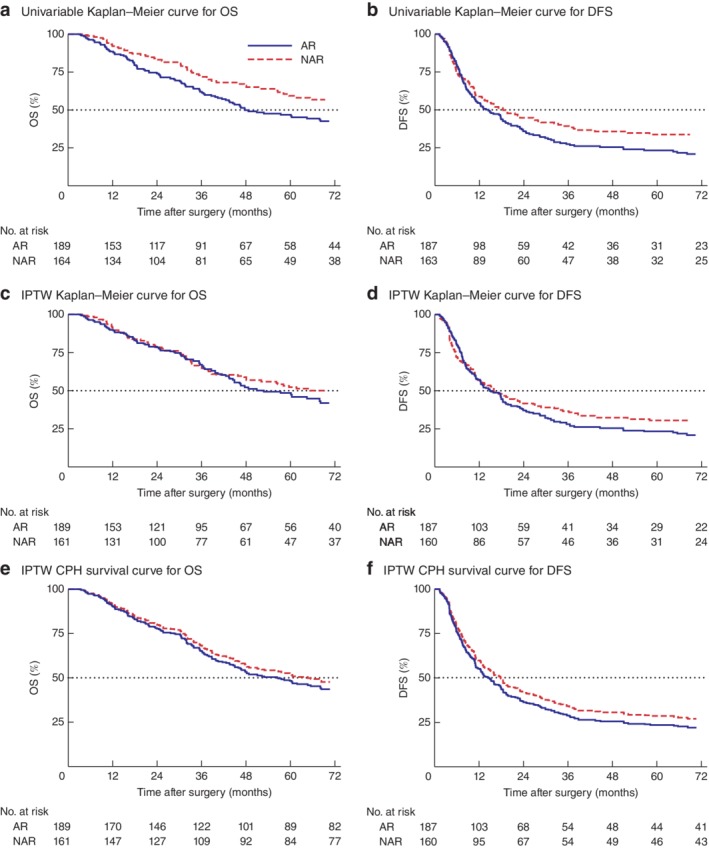
Figure 2.

Survival curves for overall and disease‐free survival stratified by resection type. a–d Kaplan–Meier survival curves for overall survival (OS) and disease‐free survival (DFS) stratified by resection type in a,b unweighted and c,d inverse probability of treatment weighting (IPTW) data sets. The dotted line indicates the median value. e,f Survival curves for the final doubly robust Cox proportional hazards (CPH) model. AR, anatomical resection; NAR, non‐anatomical resection. a P = 0·004, b P = 0·045, c P = 0·221, d P = 0·273, e P = 0·537, f P = 0·429 (log rank test)
