. 2019 Jun 7;10(29):7111–7118. doi: 10.1039/c9sc02301a

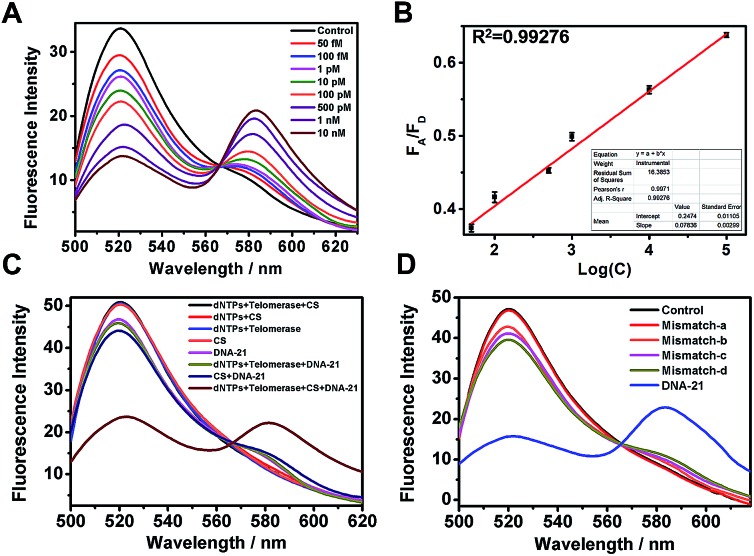
Fig. 1. (A) Fluorescence spectra determination at various DNA template concentrations from 50 fM to 10 nM. (B) Linear relationship between FA/FD signal and log concentration (Log(C)) of the DNA template. (C) Fluorescence spectra determination with or without each component of the testing system when DNA template was presence or absent. Ratioflare concentration was fixed at 2 nM in each group. (D) Distinguishing middle-mismatched templates (mismatch-a and mismatch-b) and terminal-mismatched templates (mismatch-c and mismatch-d) from complementary target DNA-21. No template was added in the control group. Error bars show standard deviations of three replicates. λex = 492 nm, λem(FAM) = 520 nm, λem(TAMRA) = 580 nm.

Fig. 1