. 2019 Jun 7;10(29):7111–7118. doi: 10.1039/c9sc02301a

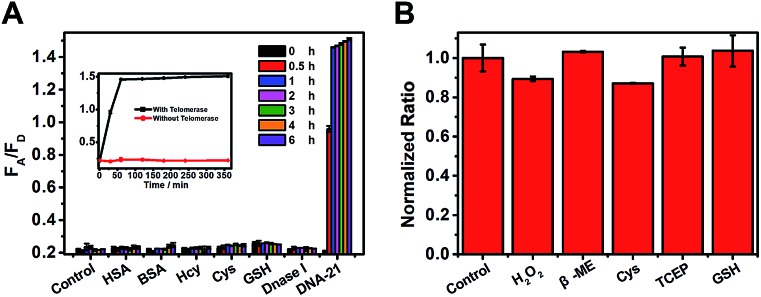
Fig. 2. (A) FRET fluorescence signal toward various analytes. 10 nM for DNA-21 template and 5 mM (500 equiv.) for all other analytes. Each bar represents relative responses at 0 h (black), 0.5 h (red), 1 h (blue), 2 h (pink), 3 h (green), 4 h (orange), and 6 h (purple) after adding the appropriate analytes. (B) Normalized fluorescence emission signal of telomerase-catalyzed FRET ratioflares (2 nM) after 12 h of incubation with different reactive additives, showing the stability of the probes with respect to the reactive additives. Error bars show standard deviations of three replicates. λex = 492 nm, λem(FAM) = 520 nm, λem(TAMRA) = 580 nm.

Fig. 2