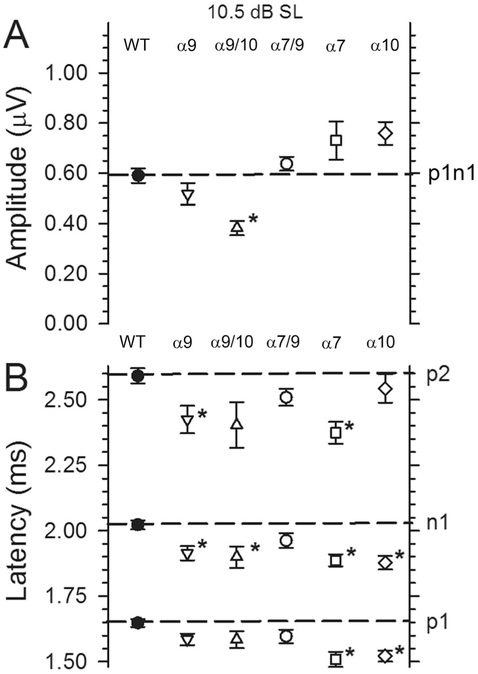
Figure 11.
A,B: VsEP amplitudes and latencies recorded at +10.5 dB above threshold (dB SL) for all genotypes. This facilitates comparison of response features across all genotypes. Note that amplitudes were significantly reduced (*P < 0.003) compared with WT only in α9/10 KO animals, whereas significantly shorter n1 latencies were resolved for α9 KO, α9/10 KO, α7 KO, and α10 KO animals. n1 Latencies remain the same as WT only in α7/9 KO animals.

