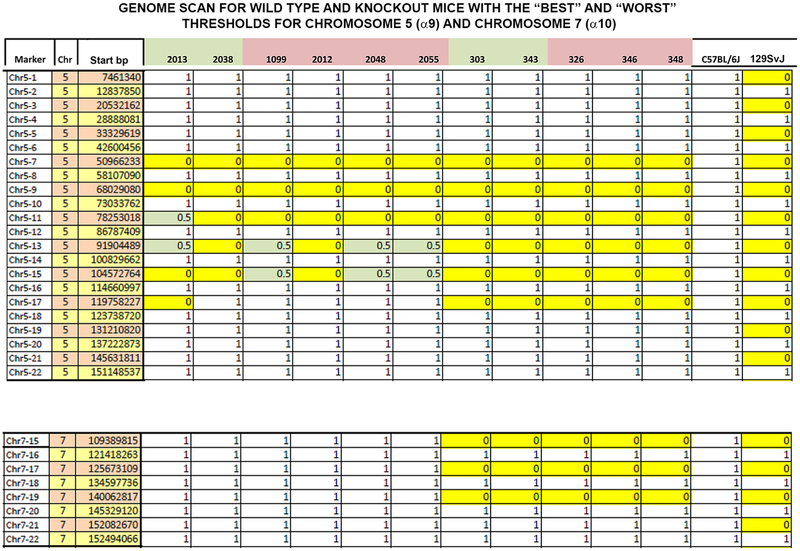
Figure 13.
The amount of 129/sv background flanking CHRNA9 (upper panel) and CHRNA10 (lower panel) was determined by using SNPs, as described in Materials and Methods, for several α9 KO and double α9/10 KOs with the “best” and “worst” thresholds. Along the y-axis is shown the marker, chromosome (Chr), and starting base pair (bp). CHRNA9 is located on chromosome 5 (upper panel), and CHRNA10 is located on chromosome 7 (lower panel) in the mouse. Along the top are the animal numbers. Animal numbers in green had the best thresholds and animals in pink had the worst thresholds. Zero (yellow) is 129/sv, and 1 (blank) is C57Bl/6J background. The 0.5 indicates heterozygotes. The animals with the best threshold (2038) and the worst threshold (2012) have an identical strain characterization pattern. This analysis cannot eliminate all genetic effects on the phenotype; for example, it cannot eliminate genes closely linked to CHRNA9 or CHRNA10.

