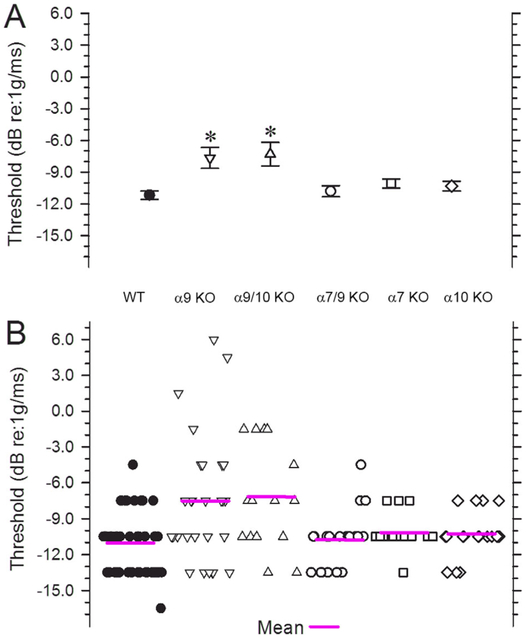
Figure 7.
VsEP thresholds. A: Mean (magenta lines) and SE for VsEP thresholds. B: The distribution of thresholds in individual animals for the six genotypes is shown (WT, α9 KO, α9/10 KO, α7/9 KO, α7 KO, and α10 KO). Mean thresholds for α9 KO and α9/10 KO animals were significantly higher (*P < 0.0002) than in WT animals. In contrast, there was no significant difference in thresholds between WT and α7/9 KO animals, nor was there a difference between threshold means for α9 KO and α9/10 KO animals.

