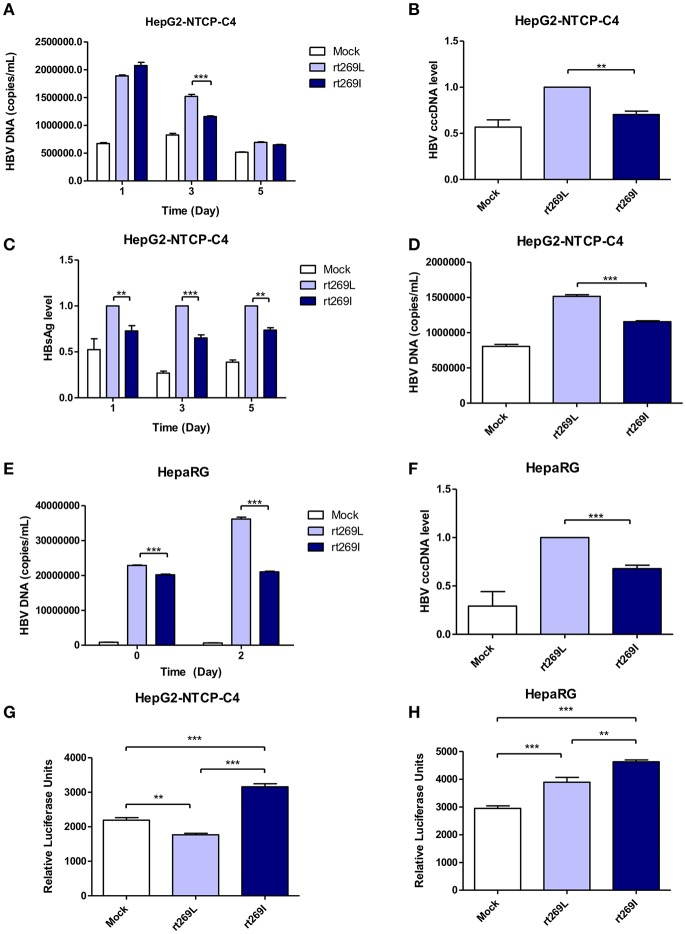
Figure 3.
The enhanced replication capacity of rt269L vs. rt269I shown in HBV infection models (A–D) rt269L- or rt269I- HBV variant infection of HepG2-hNTCP-C4 cells. (A) Intracellular HBV DNA level were evaluated using qPCR on day 1, 3, and 5. (B) HBV cccDNA level was measured in HepG2-hNTCP-C4 cells infected by each HBV variant on day 5. (C) HBsAg secretion in the supernatant of infected cells were measured using ELISA on day 1, 3, and 5. (D) Extracellular HBV DNA level were evaluated using qPCR on day 3. (E,F) rt269L- or rt269I- HBV variant infection of HepaRG cells. (E) Intracellular HBV DNA level was measured using qPCR on day 0 and 2. (F) HBV cccDNA level was evaluated in HepaRG cells infected by each HBV variant on day3. (G,H) The secreted IFN-I in HepG2-hNTCP-C4 (G) and HepaRG cells (H) infected by each construct was measured using luciferase reporter assay on Day 5 and day 0, respectively. Data represents mean ± S.D. of three independent experiments. One- and two-way ANOVA were used. *p < 0.05, **p < 0.01, ***p < 0.001.

