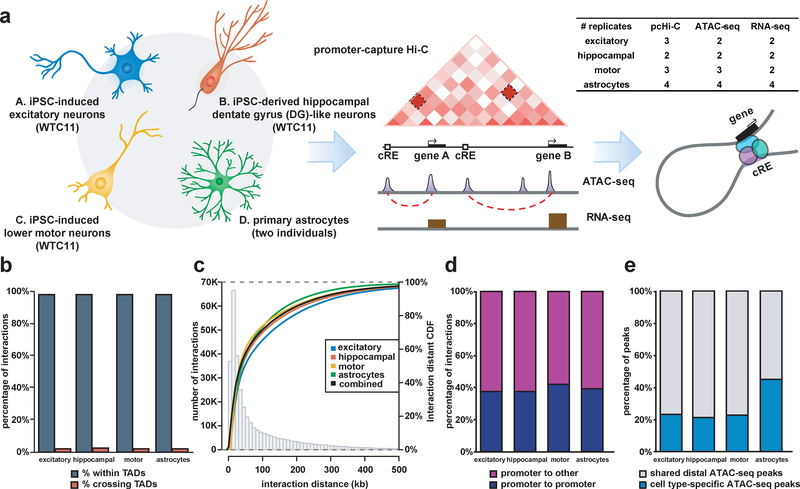
Figure 1. Genome-wide mapping of physical chromatin interactions in functionally distinct neural cell types.
(a) Schematic of the study design for generating four functionally distinct cell types in the CNS and performing integrative analysis of chromatin interactions using pcHi-C, open chromatin regions using ATAC-seq, and transcriptomes using RNA-seq. The number of biological replicates based on independent experiments for each cell type is shown for each assay. (b) Proportions of interactions occurring within TADs for each cell type. (c) Histogram and empirical CDF plots of interaction distances for each cell type. (d) Proportions of interactions between promoter-containing bins (blue) and between promoter- and non-promoter-containing bins (purple) for each cell type. (f) Proportions of cell type-specific (blue) and shared (grey) distal open chromatin peaks at PIRs for each cell type.

