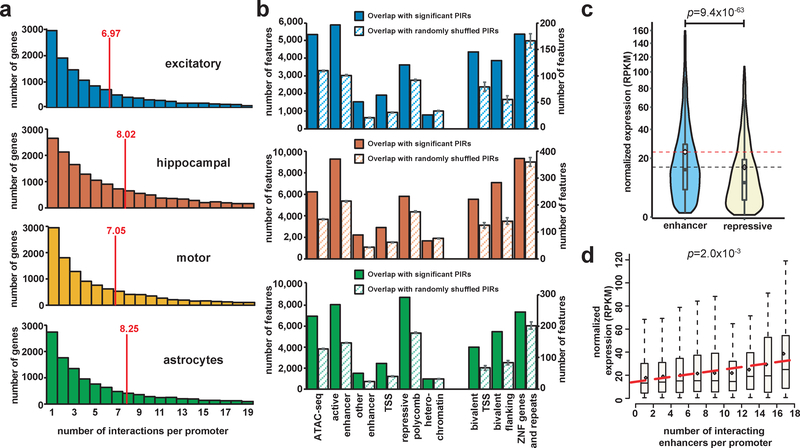
Figure 2. Integrative analysis of chromatin interactions, epigenomic features, and gene expression.
(a) Histograms of the number of PIRs interacting with each promoter for each cell type. Means are indicated. Only protein coding and noncoding RNA promoters interacting with at least one PIR are included (15,316 promoters in excitatory neurons, 19,546 promoters in hippocampal DG-like neurons, 14,990 promoters in lower motor neurons, and 15,397 promoters in astrocytes). (b) Bar plots showing counts of epigenomic chromatin states inferred using ChromHMM in matched tissues overlapping significant (solid bars) versus randomly shuffled (striped bars) PIRs for each cell type. Means and the SEM for the number of overlaps across n = 100 sets of randomly shuffled PIRs are shown. (c) Comparative gene expression analysis across all cell types for expressed genes (normalized RPKM > 0.5) whose promoters interact exclusively with either enhancer-PIRs (n = 6,836 genes) or repressive-PIRs (n = 2,612 genes) (P = 9.4 × 10−63, t = 16.9, df = 6854.6, two-tailed two-sample t test). Violin plots show the distributions of gene expression values within each group, and boxplots indicate the median, IQR, Q1 – 1.5 × IQR, and Q3 +1.5 × IQR. Means are indicated with dotted horizontal lines. (d) Distributions of gene expression values across all cell types for expressed genes (normalized RPKM > 0.5) grouped according to the numbers of interactions their promoters form with enhancer-PIRs. Boxplots indicate the median, IQR, Q1 – 1.5 × IQR, and Q3 + 1.5 × IQR. Linear regression was performed on the mean gene expression values for n = 9 bins containing at least 10 genes (P = 2.1 × 10⁻³, F1,7 = 22.7, F-test for linear regression).

