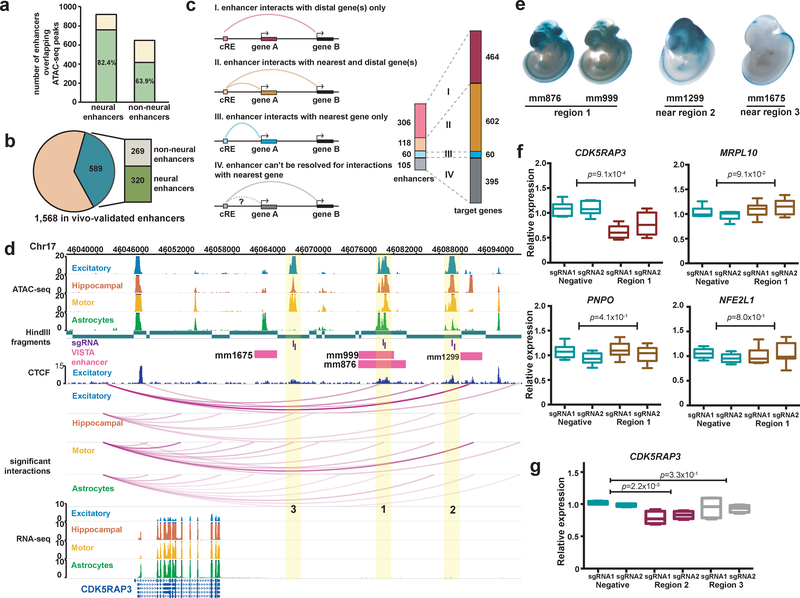
Figure 4. Validation of PIRs in human neural cells.
(a) In-vivo-validated enhancer elements with neural annotations overlap a higher proportion of open chromatin peaks in the neural cells (757 of 919 elements) compared to enhancer elements with non-neural annotations (415 of 649 elements) (P < 2.2 × 10⁻¹⁶, χ2 = 67.5, df = 1, Pearson’s chi-squared test with Yates’s correction). (b) Counts of enhancer elements participating in chromatin interactions (589 of 1,568 elements) with neural and non-neural annotations. (c) Counts of enhancer elements interacting exclusively with their nearest genes (blue), more distal genes (pink), or both (orange), and the number of target genes for each scenario (right). (d) Open chromatin peaks in cell-type-specific PIRs (regions 1, 2, and 3) interact with the CDK5RAP3 promoter. Both enhancer elements (pink) and CTCF binding sites in excitatory neurons (dark blue) are localized to all three regions, and all interactions occur within a TAD in the cortical plate (chr17:45,920,000–47,480,000). (e) LacZ staining in mouse embryos reveals tissue-specific patterns of enhancer activity. (f) CRISPRi silencing of region 1 results in significant downregulation of CDK5RAP3 expression in excitatory neurons (P = 9.1 × 10⁻⁴, t = 4.65, df = 10 two-tailed two-sample t test). The neighboring genes MRPL10, PNPO, and NFE2L1 were unaffected (P = 9.1 × 10⁻², t = 1.87, df = 10, P = 4.1 × 10⁻¹, t = 0.853, df = 10, and P = 8.0 × 10⁻¹, t = 0.259, df = 10, respectively, two-tailed two-sample t test). Three independent replicates per condition and two sgRNAs per replicate were used for each experiment. Boxplots indicate the median, IQR, minimum, and maximum. (g) CRISPRi silencing of region 2, but not region 3, results in significant downregulation of CDK5RAP3 expression in excitatory neurons (P = 2.2 × 10⁻³, t = 5.11, df = 6 and P = 3.3 × 10⁻¹, t = 1.05, df = 6, respectively, two-tailed two-sample t test). Two independent replicates per condition and two sgRNAs per replicate were used for each experiment. Boxplots indicate the median, IQR, minimum, and maximum.

