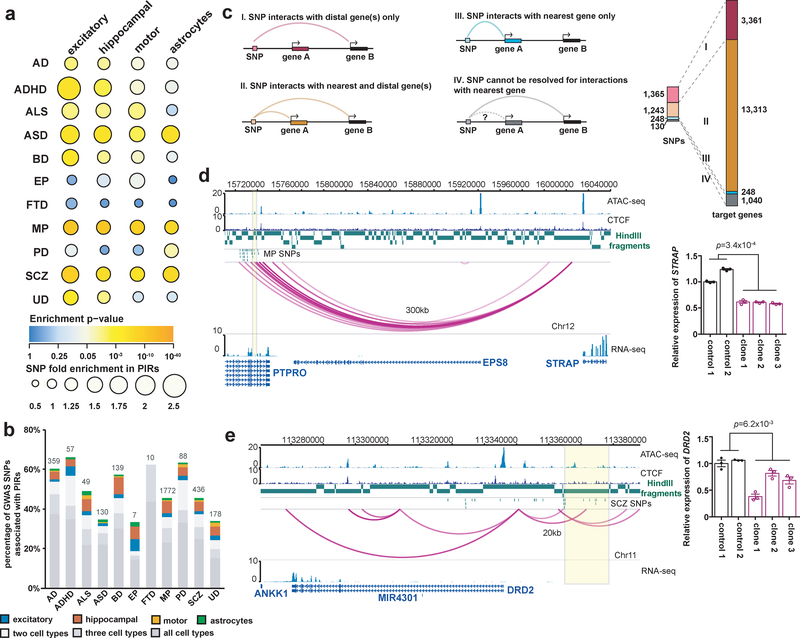
Figure 5. Genetic analysis of chromatin interactions with complex neuropsychiatric disorder-associated variants.
(a) Enrichment analysis for eleven complex neuropsychiatric disorders or traits. The color and size of each dot represent the enrichment P value (two-tailed one sample z-test) and the raw fold enrichment (determined as the number of SNPs overlapping significant PIRs divided by the mean number of SNPs overlapping n = 100 sets of randomly shuffled PIRs), respectively. The total numbers of SNPs are available in Supplementary Table 6. (b) Proportions and counts of GWAS SNPs with at least one linked SNP participating in chromatin interactions. (c) Counts of GWAS SNPs across all diseases with at least one linked SNP interacting exclusively with their nearest genes (blue), more distal genes (pink), or both (orange), and the number of target genes for each scenario (right). (d) PIRs with MP SNPS in an intron for PTPRO interact with the STRAP promoter. All interactions occur within a TAD in the cortical plate (chr12:14,960,000–16,040,000). Biallelic deletion of this PIR in three independent clones results in significant downregulation of STRAP expression in excitatory neurons (P = 3.4 × 10⁻⁴, t = 18.5, df = 3, two-tailed two-sample t test). Error bars represent the SEM. (e) A PIR containing SCZ SNPs interacts with the DRD2 promoter. All interactions occur within a TAD in the cortical plate (chr11:113,200,000–114,160,000). Monoallelic deletion of this PIR in three independent clones results in significant downregulation of DRD2 expression in excitatory neurons (P = 6.2 × 10⁻³, t = 6.92, df = 3, two-tailed two-sample t test). Error bars represent the SEM.

