
Figure 2.
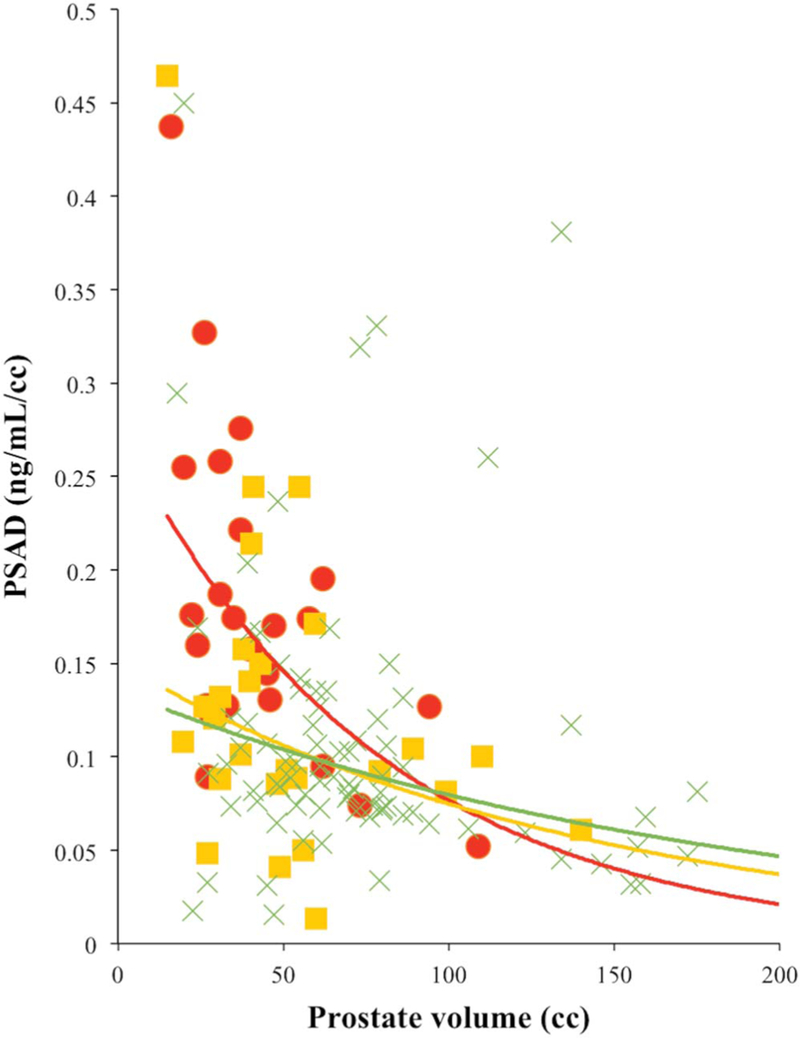
Scatterplot of PSAD vs prostate volume. Red circles represent CSPCa. Yellow squares represent CIPCa. Green crosses represent benign finding. Red curve represents exponent (CSPCa). Yellow curve represents exponent (CIPCa). Green curve represents exponent (benign).