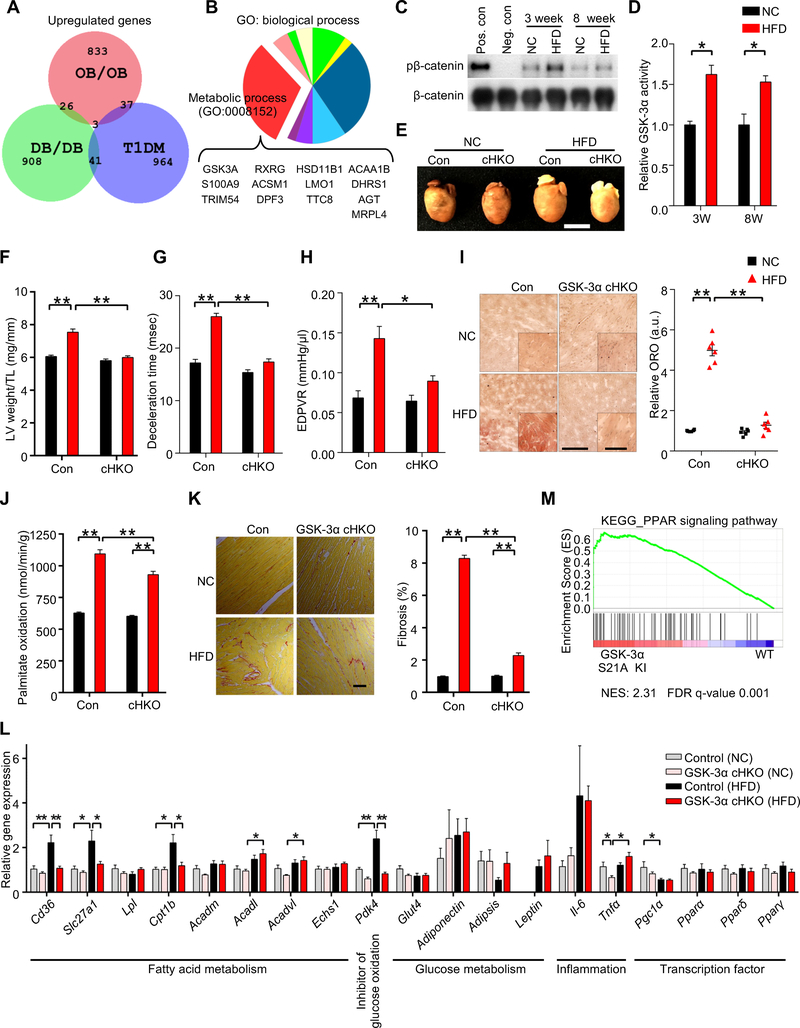
Figure 1. Cardiac-specific GSK-3α haploinsufficiency ameliorates high-fat diet (HFD)-induced lipotoxic cardiomyopathy.
(A) Area-proportional Venn diagram representing the 26 genes significantly (p < 0.05) upregulated both in ob/ob (GSE16790) and db/db (GSE36875) mouse hearts, but not in streptozotocin-induced diabetic hearts (Type I DM) (GSE5606). (B) Pie chart illustrating the percent composition of Gene Ontology biological processes of the 26 common genes found in (A). Metabolic process (GO: 0008152) contains the largest gene set (13 genes), among which only GSK-3α is a kinase. (C) Immunoblots to evaluate nuclear GSK-3α activity in the hearts of wild-type (WT) mice fed a HFD or normal chow (NC) for the indicated periods. GSK-3α was immunoprecipitated from the nuclear fraction of heart lysates, followed by in vitro kinase assays with recombinant β-catenin. Recombinant GSK-3α protein was used as a positive control and immunoprecipitation with IgG was used as a negative control. (D) Quantification of the nuclear GSK-3α activity in (C) (n = 3). (E to L) GSK-3α cardiac-specific heterozygous knockout (GSK-3α cHKO) mice and heterozygous floxed (control) mice were fed a HFD or NC for 14 weeks. (E) Photograph of the hearts of control and GSK-3α cHKO mice fed a HFD or NC. (F) Left ventricular (LV) weight normalized by tibia length, a marker of cardiac hypertrophy (n = 8 (NC) and 22–24 (HFD)). (G and H) Diastolic function, as indicated by deceleration time (n = 8–15) (G), and the slope of the end-diastolic pressure-volume (PV) relation (EDPVR) (n = 5 (NC) and 9 (HFD)) (H). (I) Lipid accumulation in the hearts (Oil Red O staining, left). Scale bar, 100 μm. Inset scale bar, 20 μm. Quantification of myocardial lipid accumulation (right) (n = 6). (J) Palmitate oxidation in the hearts (n = 8–9 (NC) and 17 (HFD)). (K) Picric acid sirius red (PASR) staining, indicating cardiac fibrosis (left). Scale bar, 100 μm. Percentage of PASR positive areas (right) (n = 4). (L) mRNA expression related to cardiac metabolism, inflammation, and transcription factors in the hearts (n = 6). (M) Gene set enrichment analysis plot of Kyoto encyclopedia of genes and genomes (KEGG). PPAR signaling signatures in GSK-3α S21A knock-in (KI) and WT mice fed NC. NES denotes normalized enrichment score. FDR denotes false discovery rate. Error bars indicate s.e.m. * p<0.05, ** p<0.001. See also Figures S1 and S2 and Table S1.

