
Figure 6a:
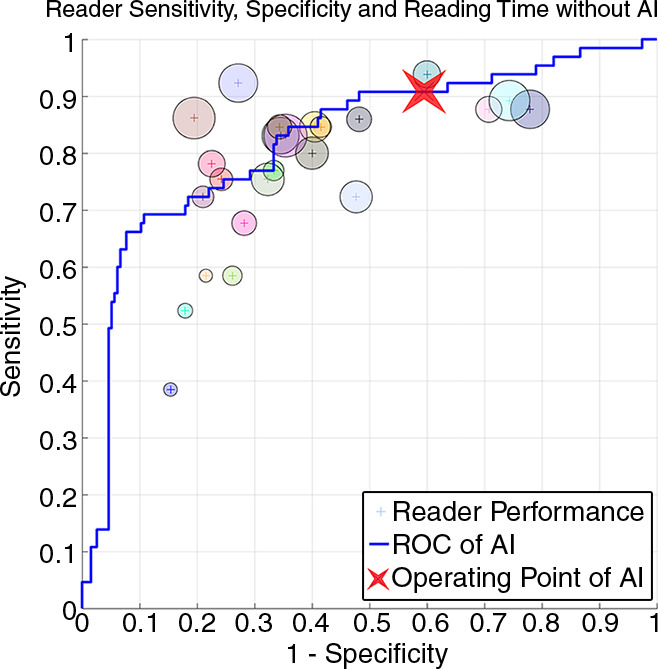
Graphs show (a, c, e) average case-level performance for each reader without artificial intelligence (AI) and (b, d, f) with AI. Locations of small circles = sensitivity and specificity. Diameters of small circles are proportional to reading time; a decrease in circle size from readings without AI to readings with AI reflects the relative decrease in reading time for the individual reader. (c–f) Graphs highlight specific groups of readers and their changes in sensitivity, specificity, and reading time. The large yellow circle in c and d shows a group of four readers who without AI have high specificity, low sensitivity, and short reading times. With AI, these readers maintain their relatively short reading times and high specificity but improve their sensitivity. As demonstrated by the large blue circle in c and d, four readers who have low specificity but high sensitivity without AI improve their reading times and specificity and maintain their relatively high sensitivity. The large yellow circle in e and f shows a group of readers with generally high sensitivities and specificities without AI who with AI generally improve all three parameters (reading time, sensitivity, and specificity). The large blue circle in e and f indicates the only two readers in our study who had slight decreases in area under the receiver operating characteristic (ROC) curve (AUC) when reading with AI compared with reading without AI. Their reductions in AUC were quite small at −0.014 (right small circle) and −0.004 (left small circle); however, they both experienced significant reductions in reading time. The right reader had the fourth largest reduction of all readers of −65.7 seconds, and the left reader had the largest reduction of all, −90.4 seconds. (a–f) Graphs also show the AI stand-alone performance ROC curve (no human reader, blue line) and operating point (red “X”) with the 260 enriched reader study cases. The AI operating point case-level sensitivity was 91% (59 of 65; 95% confidence interval [CI]: 81%, 96%), and its specificity was 41% (79 of 195; 95% CI: 34%, 48%).