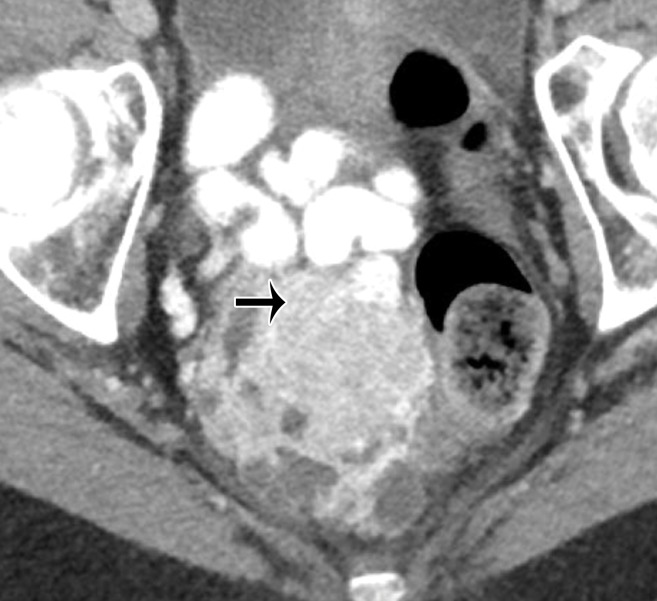
Figure 20b.
(a) Sagittal T2-weighted image shows a large retrorectal mass with low-to-intermediate SI due to fibrous tissue (black arrow) and areas of high SI consistent with cystic areas (pink arrow). (b) Axial CT image shows intense enhancement (arrow). Results of pathologic analysis were consistent with solitary fibrous tumor.

