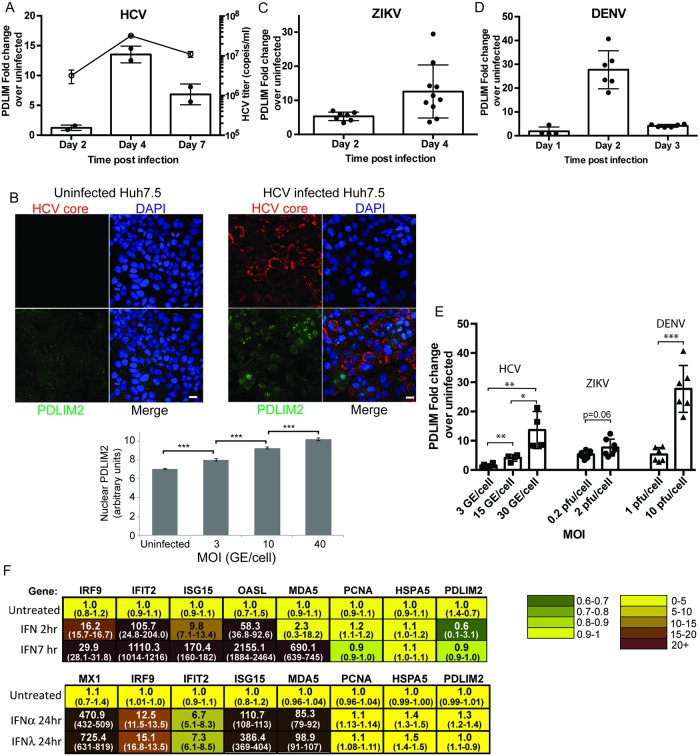
Fig 3. PDLIM2 is induced in virally infected cells but not in cells treated with IFN2α.
Huh7.5 cells were infected with either 3 genomes/cell of HCV JFH-1 (A and B) or 0.2 pfu/cell of ZIKV (C), or 10 genomes/cell of DENV (D) and harvested on the days indicated. The levels PDLIM2 mRNA were quantified by qRT-PCR, normalized to HPRT levels and compared to the amount in uninfected cells. In the case of HCV, cell culture supernatants were also harvested, virus isolated and the HCV viral titers determined by qRT-PCR (shown as the line graph in A). B) Uninfected or HCV infected cells were fixed and stained with antibodies specific for PDLIM2 (green) or HCV core (red) and a minimum of 416 cells at each moi were quantified. Error bars indicate SEM. Unpaired t-tests were used to determine significance, and *** denotes p<0.001. E) Huh7.5 cells were infected with the indicated MOI of HCV, ZIKV, or DENV, and the cells harvested after 4d, 2d, or 2d respectively, and the PDLIM2 mRNA levels determined by qRT-PCR. Error bars indicate standard deviation. F) Interferon response gene expression (ISG) in Huh7.5 cells treated with IFNα2. Huh7.5 cells were untreated or treated with 1000 IU/mL of IFNα2 for 2h or 7h or 24h, or 100 ng/mL IFN-λ3 for 24h. RNA was isolated and qRT-PCR was performed using a custom TaqMan OpenArray. HPRT was used to normalize mRNA levels and the average of the duplicate untreated sample was used to determine the fold increase after interferon treatment. The range is shown in brackets below the average.

