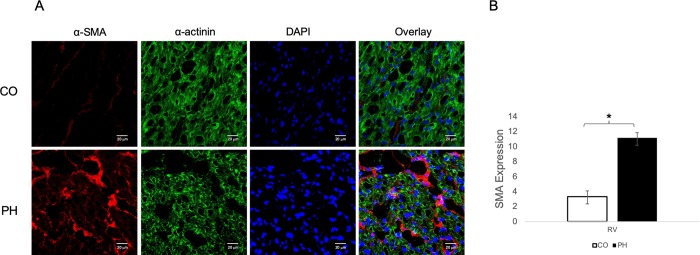
Fig 1. Pulmonary hypertension (PH) induces myocyte disarray in vivo.
A) Representative images of mid-RV sections stained for α-SMA (red) and α-actinin (green). RV from control (CO) calves express little α-SMA and are highly organized. However, RV from PH-exposed (PH) calves express higher α-SMA and the normal organized structure of cardiac tissue is disrupted in areas expressing high α-SMA. DAPI (blue) identifies nuclei. Images were taken at 40X, with Zoom at 63X on a Zeiss Laser Scanning Microscope 780. B) Quantification of α-SMA in RV of control and PH-exposed calves (n = 12 CO; n = 12 PH).

